Pearson's Correlation in SPSS (Context+Analysis+Reporting)

HTML-код
- Опубликовано: 20 фев 2020
- This video illustrates the basic principles of Pearson's bivariate correlation, the calculation process using SPSS and reporting style according to APA style.
Correlation is a measure of the strength of a linear association between two variables and is denoted by r.
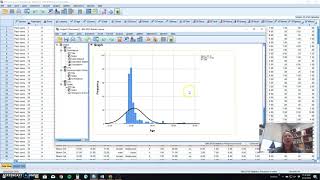
Basically, attempts to draw a line of best fit through the data of two variables, and the r indicates how far away all these data points are to this line of best fit (how well the data points fit this new model/line of best fit).
Falls between -1 and +1, with a sign indicating the direction of the association
টাকা পয়সা বেশি থাকলে কী জীবনে সুখও (লাইফ স্যাটিসফ্যাকশন) বেশি হয়? অথবা ফেসবুকের ফলোয়ারের সংখ্যা কি একজন লেখকের বই বিক্রির সাথে সম্পর্কিত?
সামাজিক বা জীব বিজ্ঞানের গবেষণায় সচরাচর এরকম বিভিন্ন ভ্যারিয়েবলের মধ্যে সম্পর্ক বের করা হয়। ভ্যারিয়েবলের মধ্যে সম্পর্ক দেখার সাতটি বহুল প্রচলিত উপায়ের মধ্যে আজকে দেখব Pearson's correlation। দু'টি ভ্যারিয়েবল যদি continuous scale মেজার করা হয়, তাহলে সাধারণত Pearson's correlation করতে হয়। একটু সময় দিয়ে পুরো লেসনটি দেখুন। Pearson's correlation ক্লিয়ার হয়ে যাবে। প্র্যাক্টিস ডাটা সেট এবং রেজাল্ট লিখার নমুনাও ডাউনলোড করে নিতে পারেন।
#SPSS #Bivariate_correlation #হাতেকলমে_SPSS
Azharul Islam
Assistant Professor
Department of Educational and Counselling Psychology
University of Dhaka
Course Content
1. The research process: An Overview • The Research Process: ...
2. Preparing a research tool/survey questionnaire • How to prepare a resea...
3. Codebook and coding for SPSS • How to prepare a codeb...
4. Levels of Measurement/ Scales of Measurement • Scales of Measurement:...
5. Creating data file and entering data in SPSS • Data entry in SPSS: St...
6. Data cleaning in SPSS • How to clean data (err...
7. How to split file and select cases in SPSS • Select cases in SPSS w...
8. How to split a file in SPSS www.youtube.com/watch?v=N_GgF...
9. Transforming data: Compute and Recode in SPSS • Transforming data: Com...
10. Data analysis in SPSS: An overview • Research data analyses...
11. Descriptive statistics in SPSS • Research data analyses...
12. How to conduct Independent Samples t-test in SPSS (Context+Analysis+APA Reporting) • How to conduct Indepen...
13. How to conduct One-Sample t-test in SPSS (Context+Analysis+Effect size+ APA Reporting) • How to conduct One Sam...
14. How to conduct Paired Samples t-test in SPSS (Context+Analysis+Effect Size+APA Reporting) • How to conduct Paired ...
15. How to do Chi-Square Goodness of Fit test in SPSS (Context+Analysis+APA Reporting) • How to conduct Chi-squ...
16. How to conduct a Chi-Square test of Independence in SPSS (Context+Analysis+APA Reporting) • How to run Chi-square ...
Exploring relationships between variables in SPSS
17. Bivariate correlation in SPSS • Pearson's Correlation ...
18. Partial and semi-partial correlation in SPSS • How to calculate and r...
19. Spearman’s rho/Kendall’s Tau-B in SPSS • How to calculate Spear...
20. Standard multiple regression in SPSS • Multiple Linear Regres...
21. Hierarchical multiple regression in SPSS • Hierarchical Multiple ...
22. Binary logistic regression in SPSS • Binary Logistic Regres...
Comparing more than two groups in SPSS
23. One-way between-groups ANOVA in SPSS • One-way between-groups...
24. One-way ANOVA for repeated measures in SPSS • One-way Repeated Measu...
25. Two-way ANOVA for independent groups in SPSS • Two-way between groups...
26. Two-way ANOVA for repeated measures in SPSS • Two-way repeated-measu...
27. Mixed-method ANOVA in SPSS • Mixed-Design ANOVA in ...
Examining the underlying structure or reliability of measures
28. Exploratory Factor Analyses in SPSS • Exploratory Factor Ana...
29. Internal consistency in SPSS • Calculating and Interp...
30. Interrater reliability in SPSS
31. The intra-class correlation coefficient in SPSS
32. Test-retest reliability in SPSS
My books.........................................
জাদুকাঠি tinyurl.com/ratru8j
মনোসন্ধি tinyurl.com/tcdzame
হইচই tinyurl.com/u68gs4q
মানসিক স্বাস্থ্যবিষয়ক ই-ম্যাগাজিনঃ
মনোযোগী মন www.monojogimon.com
Let's be in touch.........................................
Facebook tinyurl.com/tor8p23
Research Gate tinyurl.com/uuarq6l
Downloads.........................................
Practice data set tinyurl.com/rd2nwjq
Writing template tinyurl.com/s88m4au
References (books) .........................................
1. Field, A. (2017). Discovering Statistics Using IBM SPSS Statistics (5 ed.). California: SAGE Publications Ltd.
2. Pallant, J. (2010). SPSS Survival Manual: A step by step guide to data analysis using SPSS: Allen & Unwin Australia.
3. Allen, P., Bennett, K., & Heritage, B. (2018). SPSS Statistics: A Practical Guide: Cengage Learning Australia.


Fantastic video.
Eto kom view ...ভাইয়া apni 50k Subscribe deserve koren .. apnar video ami share korbo নিশ্চয়
Khub sundor kore bojan ,Sir spss ta.
Thank you very much
Sir I have a confusion and that is should we check the correlation between dependent and independent variable???
In your example, which one is dependent and which one is independent!!
Your videos are just mind blowing but I have enough confusion here!
Great Brother
Thanks for the visit
thank you sir
you are welcome.
Your tutorials are excellent. Would you please take initiative to make tutorials on SMART PLS 3. Thank You.
Thanks for your comment. Actually, I do not have plan to make tutorials on SMART PLS 3. We will cover some modelling tutorial using SPSS AMOS.
correlation ber korte gender include korar system ki? amar variable list e nominal data show kore na keno???
Should I use inferential statistica table in thesis result section?
yes
Thank you bhaiya ...its such a great channel...do you have any vedio about installing spss free forever ...
Thank you for your feedback. Sorry, I do not have a video on installing SPSS free forever.
Fabulous Presentation!! Thank you sir.
But how can I report Pearson correlation with multiple(like 3 or 4) variables?
Not a problem. Correlation always counts two variables. With 3/4 variables you would get a correlation matrix.
Sudor vabe present koresen !
Bhaiya
Jodi 3 ta scale use hoy tokhon ki correlation dekha jabe?
Jabe. Correlation matrix hobe. Correlation always duita variables er moddhe hoy.
Assalamualikum Sir. Myself nusrat Jahan from department of Educational and Counseling Psychology, Dhaka University. Sir your Videos are very helpful for those who are interested in doing research. It will be grateful if you provide information about how to conduct test retest reliability in SPSS and how can we put data when we are trying to find out Test retest reliability.
WS Nusrat. As the name indicates, the Test-retest reliability is calculated by checking whether the test scores obtained in time 1 and time 2 (usually after a few weeks) are correlated or not. If we see, a high correlation between time 1 and time 2 test scores, we say that the test has high test-retest reliability or temporal stability. For your second question, you can open a separate SPSS file, create three variables (id, Time1score, Time2score) and enter only the total score of your scale obtained in Time 1 and Time 2. Then, you will be able to run a simple correlation.
Thank you very much Sir. This information is very effective. now I am clear . I have another question to ask for better clarification. Can you provide the steps of analysis through SPSS and meanings of results?
@@NusratJahan-pq7bg I have the plan to make a video on test-retest reliability, but it may take time as I am busy with my own research now. Check the internal consistency reliability video, the interpretation is quite similar. Also, you can see published article to get some idea of how the authors reported results of test-retest reliability.
Thank you Sir. Its my pleasure
You are welcome
Sir is it mandatory that the data should be normally distributed for Pearson correlation?
Yes
Sir, 'correlation is significant at 0.01level' ashle ki evabe likhle vul hobe... correlation between X and Y is significant (r = , n= , P
Thik ache
Thanks a lot sir!