You must have some different format settings because when I create the initial scatter chart, I don't get dates across the middle like you did, I just get numbers from 0 to 16.
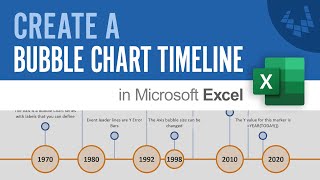
Is there a way to connect two data points that aren't in order? For example if I wanted to connect the bottom right dot, and the one two spaces above it?
They would need to be a different data series if you wanted to use add a line using the chart options. The line option always draws a line between to adjacent points, but with an X-Y scatter plot, those points do not need to be in chronological order. But, the line option turns on the line for the entire data series. If you aren't going to be changing the chart in the future, you could just overlay a line object on top of the chart.
1:10 Wow - you went past "swamp the reference in the formula bar" so fast, I still can't figure out what you did and I'm on my 4th time watching it ... I wish you had slowed down and explained this a little better :-(
When you click on the data series, you can edit the formula directly in the formula bar, swapping the references within the SERIES formula. For example, if the formula was =SERIES("Timeline",$M$3:$M$15,$K$3:$K$15,1) then edit the formula to change the M's to K's and vice versa.
This is obviously late, but I noticed at 1:10 there are 4 things separated by 3 commas. For example: "$sheet3A,$sheet3B,$Sheet3C,1". In the video she cuts the middle $sheet3B and pastes after $Sheet3C, but before 1. Switching them so it becomes "$sheet3A,$Sheet3C,$sheet3B,1" (B and C are swapped). Hope that helps!


Wow, this is way more complicated than I thought but I appreciate you spelling it all out, step by step. Off to give it a try...
You must have some different format settings because when I create the initial scatter chart, I don't get dates across the middle like you did, I just get numbers from 0 to 16.
TANK YOU VERY MUCH
Is there a way to know where the position should be
Is there a way to connect two data points that aren't in order? For example if I wanted to connect the bottom right dot, and the one two spaces above it?
They would need to be a different data series if you wanted to use add a line using the chart options. The line option always draws a line between to adjacent points, but with an X-Y scatter plot, those points do not need to be in chronological order. But, the line option turns on the line for the entire data series. If you aren't going to be changing the chart in the future, you could just overlay a line object on top of the chart.
1:10 Wow - you went past "swamp the reference in the formula bar" so fast, I still can't figure out what you did and I'm on my 4th time watching it ... I wish you had slowed down and explained this a little better :-(
When you click on the data series, you can edit the formula directly in the formula bar, swapping the references within the SERIES formula. For example, if the formula was =SERIES("Timeline",$M$3:$M$15,$K$3:$K$15,1) then edit the formula to change the M's to K's and vice versa.
@@vertex42 I tried that and I must have messed something up because it created a completely different chart.
It works better in a brand new worksheet - not sure what is wrong in the template worksheet.
This is obviously late, but I noticed at 1:10 there are 4 things separated by 3 commas. For example: "$sheet3A,$sheet3B,$Sheet3C,1". In the video she cuts the middle $sheet3B and pastes after $Sheet3C, but before 1. Switching them so it becomes "$sheet3A,$Sheet3C,$sheet3B,1" (B and C are swapped). Hope that helps!
Lo pueden pasar en Español. Gracias
I don't speak Spanish, so I'm not sure what that means, but hopefully it's a good thing.
@@vertex42 haha he was wondering if you could make a tutorial of this in Spanish.
Help!!!
здається я тут вже був