How to Make the BEST Gantt Chart in Excel (looks like Microsoft Project!)

HTML-код
- Опубликовано: 19 июн 2024
- ⭐️⭐️⭐️ GET THIS TEMPLATE PLUS 52 MORE here: www.etsy.com/listing/11998005...
👍 Ready made and ready to use.
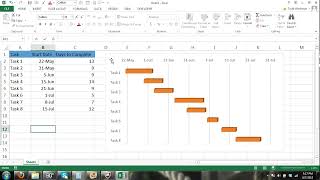
How to make the absolute BEST weekly Gantt Chart in Excel, that looks like Microsoft Project and is easier and better to use! Your managers and team will ask you "Where did you get this from?" and "Can I use it?" because it looks so good when you're updating your project.
Features include: milestone diamonds, automatic Gantt chart bars, automatic counting number of working days, automatic percent complete on Gantt bars, coloured bars for complete tasks and for blocked tasks, and automatic calendar.
Timestamps:
00:00 Gantt Chart overview
01:53 Getting Started
02:31 Creating the Calendar
05:26 Adding lines and borders
06:40 Number of Working Days
07:24 Status drop down list
09:21 Adding milestone diamonds
10:27 Adding the Gantt bars
12:33 Adding the percentage complete on the bars
13:12 Adding the complete golden colour
14:03 Showing blocked items
15:12 Freeze panes for scrolling
#ProjectManagement
All the Project Template Excel and Powerpoint videos: • How to Create Excel an...


David, you're a natural born teacher. Very much appreciate your positive and encouraging tutorial on how to do these things for yourself.
Here is the DAX for the video.
Top row dates: =IF(MONTH(D3-WEEKDAY((D3),2)+1)=$E6-(WEEKDAY($E6,2)+1),K$40,K$4=$E6-WEEKDAY($E6,2)+1)
Completed: =AND($H6="Complete",K$4=$F6-WEEKDAY($F6,2)+1)
Blocked: =AND($H6="Blocked",$I6>0,K$4=$E6-WEEKDAY($E6,2)+1)
Hope this saves future viewers some time!
Thank you so much, you saving lives here Master!
thanks so much!
do you know how i would adjust the formulas if i choose to show every day instead of every monday?
just huge respect man!
does the work day formula works for you all? I am not managing to get it properly done
Thank you so much, this was so easy to follow and re-create alongside you. My project team were impressed.
This video is fantastic and the presenter does an amazing job. David's enthusiasm is infectious and I honestly had fun making a Gantt chart for my project - never thought I'd say that!
I can honestly say, my team was impressed when I whipped this out to present the other day
Thank you, David, for an (almost) idiot-proof tutorial on creating a customized Gantt chart. It took me about 4 hours, but I'm thrilled with the result, and the fact that I can use this template for other projects in the future. Many, many thanks for your help!
I'm currently undergoing a Site Management course. I've been banging my head against the wall trying all sorts of formulas to get this right. This is by-far one of the best examples of a self-build Gantt Chart, and has become indispensable to me! Many Thanks, David!
P.S. I've managed to manipulate a formula to introduce and over run on any particular task! Again Thanks David!
Aside from the cut at 10:35ish, it was incredibly easy to follow. At that junction, there's really no explanation on what to actually do here, but fortunately I found the answer in the comments. Select K6 (assuming you followed the guide exactly) and then do ctrl+shift+end, and it will automatically select the entire chart, then you can go into the conditional formatting, select the create new rule option, paste the equation there, and then you can format the cell and continue on.
Thank you David for such a helpful and insightful video!!
Thanks David, this is one of the best tutorials available for Gantt Chart creation and Conditional Formatting
Thank you David, this is incredibly useful as I am a civil engineering student at a university that does not provide access to MS Project regardless of the crazy fees that I'm paying 🤣
This is a straight-up amazing walkthrough on how to create a well functioning Gantt Chart. Thanks so much for sharing, it will be put to great use!
Your positivity has made excel bearable for me. Thank you
David, you're making me look like a genius. This has been so informative and useful. Thanks so much for sharing.
Simply amazing! I had no idea excel sheets could look so aesthetic. You've completely changed my life, this Gantt chart is a game-changer!
@@dwightPhoenix How and where?
You have literally SAVED MY LIFE today with this!!!! Thank you!!!!!!!
Such contageous enthusiasm. I love how a square becomes "a beautiful diamond". Thanks a lot for making this one.
Fantastic step by step! Some of the bits went a little quickly so a LOT! of pausing and repalying but I now have an amazing Gantt chart to use across multiple projects! well worth the time invested.
One suggestion would be to post the different formulas in the description to make it easier and save a LOT of typing and re-typing when things go wrong.
Absolutely amazing and much needed, I was looking for some advanced Gantt chart for. months, and here I got it, many thanks, considering buying your template, looking for some discount !
Oh my Lord !! This changes everything I do at work. I thought the answer was to use Charts, but this is so much better. Thank you.
OK...this is amazing. Thank you for sharing you learning. I work in Project, but sometimes not everyone has project within an organization.
Excellent tutorial! Exactly what I was looking for. Thank you for taking the time to create and share it.
I am stranded at the addition of ghantt bars. what could be doing wrong
@@nicholastugume1081 i managed to do that, but i am stucked at the diamond milestone
@@nicholastugume1081 same, my ghantt bar isnt visible even after applying the right formula. Some formatting in the later part is not working too. Can someone help - what may be going wrong ?
Hands down the most straight forward and visually appearing GANTT chart
Ridiculously good!! So well-instructed and helpful. Thank you!!
SUPER HELPFUL!! One thing, as a new learner, I did not realize that the formulas you are plugging into the formatting don't exist in any cells yet.
Amazing tutorial , i was able to successfully create a great tracker using this. Made few tweeks to highlight overdue items status box and remove highlights from gantt chart if status marked as not started. Again thank you so much for this great tutorial , subscribed
Amit do you mind sharing code for overdue items please?
This is slick - thanks so much! Love your energy into the video. Going to use this for my next project.....people may think I know what I'm doing! :)
😄😄😄💪
OMG! i Canno believe this but I made the GANTT CHART and its amazing! Thank you for this tutorial.
Amazing, thank you! You taught me more in 16 minutes than my prof did in 4 weeks!
Great job. I completed the Gantt chart and am very excited to implement it. You are excellent, sir!
Is it too much to ask if you could kindly send your template? As you can imagine someone needing an advanced chart like this is in crunch time mode 😢. Thank you so much in advance 🙏🏻
Excellent work. This tutorial was very easy to follow and easy to implement. As a recommendation you could add the formulas on the description for faster Gantt chart creation and that way we can focus more on the explanation.
my thought exactly
I can't get any of the formulas to work, giving up. Wasted soooo much time trying. Will just buy a project software.
Clear and simple. Great job !
I’m so so grateful for your wisdom! Thank you ever so much! I can’t wait to start mine!
I am a beginner and it took me about an hour. To be honest, I never thought I would make it, anyway I tried, and I actually made it.
It wasn't that difficult because of the way you explained it all. Man, can´t thank you enough! blessings
An hour, that's impressive! It took me about a week after work to figure out all the bits and pieces, so: time saved 🙂
@@davidmclachlanproject can you please give us the functions for day per day ?
@@davidmclachlanprojecthey David I'm making this right now, an absolute beginner here. I just don't get how to like get that calender thingy. I mean the rows and columns size and height after I how to do that?
@@yourfatherofyourmother2035 Did you ever find out
Hi! I passed my PMP exam with above target in all three categories. Thanks for your videos!
That is amazing Linda, congratulations! You have conquered a very difficult task 🙂
@@davidmclachlanproject Hi David . Thanks for the video , was really helpful . How can I get this template please ? I tried creating it , but getting stuck at the end . Thanks 🙂
Clearly you are an Excel time genius! Thanks!
This is absolutely phenomenal. Great job.
Thank you for the video, David! Your instructions made it so easy to replicate. Quick question for you. Is it possible to set an estimated completion date(set with diamond on the Gantt chart) for a task, but it fills in the weekly boxes with the corresponding color as the weeks go by? Essentially extending past the diamond in the chart until an actual completion date is entered?
Excellent clip, thank you David! Very detailed and helpful. One question: is there a way to edit/ament the chart and have the months broken into weeks and the weeks into dates, and then by using the "Group" function under Date to collapse or expand the cells?
Absolutely brilliant, mate. Thank you so much. I learned so much from this.
David, you're amazing. Thank you so much for this. I'm going to put the video on super-slow-motion with my mouse hovering over the pause button and see if I can recreate something like this to fit my needs 🙂
You are my life saver THANK YOU SO MUCH for the amazing content!!!!!
p/s my team are IMPRESSED with this ganttchart for real !!!!!
This is considerably better than the ones in my work. Thank you and your formulas actually work, unlike 90% of the ones on RUclips.
Mine are not working though. "problem with formula"
@@PatchedBanditI need to change “,” to “;” and worked for me. Hope you solve that problem.
THANK YOU! Great video to help create an awesome looking and USEFUL gantt chart!
Thank you so much for this!!
I've created a Gantt chart that my boss will be happy with for a company-wide project!
⭐⭐⭐⭐⭐
Hello David, thank you for the tutorial, any chance we can switch this into a tracking sheet by days instead of weeks? What are the things we need to modify based on this tracking sheet? Thanks in advance!
This is really good! Can you show how in this example -- John is ready for another task 16 May. How do you add that without losing the previous tracked task? That way, you could forward allocate tasks and the entire year would show a record of time allocation by team member. When the director asks "what have your people been working on all year?".
It is the same example I requested now hope David give us a tutorial or a template to buy with that issue. I really need it for planning tasks!!!
Insanely helpful and clear. Thank you for sharing this...
This is a top notch tutorial for a top notch product. Appreciate your efforts a lot here David.
Absolutely great tutorial and explanation! Your positive energy has made me even more excited to start using this format. I will be updating my project timelines to this format! THANK YOU!
Hi David, great Gannt chart and very easy to follow and develop, just wondering is there an easy way to make the date dependant?
Your videos are amazing, they help me a lot in work and school. great work!
What a Gantt chart! Really the best! Thank you so much, David.
Hello, thank you for showing us how to do it. would it be possible to copy the formulas into the description so we can copy and past them in and change the cell references. I have tried to type up the formula into the cells and I keep getting error messages. It says it is too long to even try the first one. Thank you
Nice work. I added the following formula and named range to the ID# so that deleting a task renumbers and keeps the tasks id in order =IF(ROW(id)=ROW($B$5)+2,1,MAX(prev_col_range)+1) named rage id = $B5 and named range prev_col_range = $B$5:B4
Nice one! 👍
How to change if i want month
Hey Paul what cells do you apply this to?
Thank you very much for the tutorial! My head is already aching from working on this Gantt chart. My boss has been requesting it for weeks.
This is exactly what I was looking for! Thanks a million!
great video; may I ask if you provide the formula where you use to format the dates across the year?
I think you are asking about 2 consecutive calendar years:
How do you sort by start dates if your project spands TWO years?
For the Milestones, none of my conditional formatting is working when plugging in the formulas, and the wingdings aren't showing up. Need help!
Thank you so very much! I feel so proud of myself...courtesy of your shared wisdom and insane Excel skills!
This is absolutely outstanding and exact what I was looking for. SUBSCRIBED!
Great video, thank you! If I want to take the individual days timeline and turn them into weeks across a month, how could I do that?
Did you ever find out how to do this?
@@Safari_Secrets. no
May I suggest that we organize (organise) a project to incorporate some / all of the desired features:
• Critical Path Analysis
• Dependencies of Activities
• Resources Loading
• "What if" scenario calculations
• Resource leveling / smoothing
• Unexpected loss / delay of a resource
•
•
You, Sir are one of my favorite human beings!
Thank you so much David. You saved my life. I appreciate your way of teaching
Hi David, hope you are open for development suggestions, if so @1:22 when you select complete, the progress should ideally default to 100%.
I agree…what formula would you recommend?
Hey David, just wanted to say that I love what you created. I wanted to ask if you have expanded any further using Gantt charts on excel? For example adding in a critical path or milestones, keeping track of budget used in each phase etc
Would love to see this as well! Let me know if you found somewhere else to do this
that would be awsome, since the critical path is.. well.. CRITICAL in any project
OMG This is amazing.
Thank you so much for these thorough cool tips to make this semi-automated gantt chart. Awesome !!!! 🎉🎉🎉🎉🎉🎉
Really impressive, want immediately start rebuilding. Thank you so much!!
Its crazy how you manage to use excel to create such a complex and useful gantt chart. I can barely get my formatting to work hahaha. Great stuff.
A2¹
@David McLachlan if you add this code into it =IF(ISBLANK($B6),TRUE, FALSE) into a rule with the right fills and what not it can hide cells, not in use until task number is add to make it look even cleaner
👍
💀☠💀masterpiece comment. what a genius😏
bye
@@kelon_ good. stay away
Nice presentation
This is amazing, I did something different but I will say whenever I have a doubt I will turn up to this video first. Thank you for the video.
Simply brilliant. This was the literally fun to create. Much gratitude!
A couple of thoughts: drop down lists maybe on a separate 'tools' sheet: easier to use across tabs and to update. Use a table for the list. % complete only for when the output is countable. Estimates never work. If there is no countable output, the activity is 0% until it is 100%. And 100% means accepted by the PM (and the client). IMO, better to have an expected completion date, so it is concrete and drives commitment on the reporter.
These are great ideas, certainly do-able 🙂
@@davidmclachlanproject David, glad you found my thoughts of interest. One more thought, in my domain, a milestone is a durationless event; I identify a milestone as an activity of zero duration: so start and end dates are the same. They usually come at the end of a sequence of activities that produce a work package or discrete component.
Hi @David,
Great work. How can we break down the timeline from weeks to days. Your inputs will be really helpful. Thank you for the video. 🙏
@David, answer please to this question
Do we already have an answer for this? 🙏
Instead of +7 change to +1
@@vcanadian1971 The conditional formatting formulas need to be changed as well.
This is sooo cool! Thank you so much for sharing your knowledge and expertise :)
Very very impressive chart. Im 100% going go make one, its 100% going take me hours to do though 🤣
It took me two weeks to figure it all out and put it together, but I am not the fastest person 😂
Im a project manager and that chart is going to become part of my arsenal. Thank you!
Well done. Though it is missing a key component of a gantt chart: Dependencies. The whole purpose of a (complete) gantt chart is to show what tasks depend on what other tasks and what the impact of changing one or more tasks has on the schedule. If your intention was artistic in nature, this is very good. But don't sell this as a gantt chart.
Thanks for showing how to build our own sheets. Much more impactful than simply uploading someone else's sheets.
I agree. The point of using a tool like MS Project is for predecessors and successors and the whole scheduling engine. Also, summary tasks and other features for navigating a large project schedule. Not to mention resourcing features. Excel might be OK for a very simple task list but I can't imagine running an actual project without something like MS Project!
See my question about the FOUR types of dependencies.
I think how important this is depends on the size of the project, Many mini projects can and are managed on excel sheets manually and this automates some of the basic functions of laying out a chart. I find managing an ms project plan cumbersome in pretty much all but the most rigidly defined projects. Equally i often find faults in the ms-project scheduling engine that can put your entire plan out of kilter, meaning you up end spending more time getting your plan to behave correctly than you do actually delivering anything. In the kind of environments i manage manage projects in i need something that is quickly editable on the fly at a whim, without being to concerned with what impact changing one line may have on the rest of the plan. I can make notes against the cells in excel and cater for the dependencies later when i have time. Also in complex changing environments dependencies are always changing , and often things that you thought were dependencies turn out not to be and vica versa. In my experience having a plan that is a little looser in is restrictiveness can actually be helpful for a busy project manager.
@@danielbarnatt9332this has been my experience as well.
Any MS project schedule I create is like a beautiful work of art on Day 1. But I’ve never successfully tracked progress in it.
I’ve been developing a “task list” in excel that simply has tasks, estimated hours per task, and a “percent complete” cell, which drives 10 conditionally formatted cells that represent a “gas gauge” - how close to done the task is,
From 1-10
Real life is always way more complicated than an MS project schedule.
The fact that project doesn’t let me take notes anywhere on the screen just kills me.
I’m reinvigorated with the idea of doing this in excel (and keeping it very simple) due to recently working with a very competent project manager who uses a white board and post-it notes. He doesn’t use a computer at all, let alone MS project.
(And I just save the excel file with a new date in the filename each time, so I could always go back in time super easily if I ever wanted to…)
Thanks, David! Despite the availability of other tools, I felt compelled to give this one a try. I've just forwarded my Gantt chart to my supervisor.
Hi can I have the completed gannt chart please..I can't get the formulas to work
Thank you for the detailed explanation. Really helped me out when my boss asked me to prepare a project tracker...
Thanks for such wonderful video, but I failed to do the today’s bar. Tried few times with the possibilities on my understanding. Can u teach again on where should I type the formula? Thanks
Same place i got stuck because if I put the formular it gives me error. Did you find a way around it?
@@ibd991 yes. I found the solution. how about you?
@@chloehugaga2203can you please share it?
Took me 4 hours...lol, but that was great. Thanks!!!
It took me 2 weeks, so you did well 😂
Amazing step by step explanation!
You are amazing, thank you so kindly for taking your time to share this tutorial.
Do you have a tutorial on how to add dependencies between tasks? Great video!
Not yet but it's a good idea 🙂 Will get on it soon!
@@davidmclachlanproject loved this video and was able to get a gantt up and running, Having the ability to do dependencies would be amazing
This is a great video but for us beginners it goes a little fast. I wish it was a little more broken down in the formatting portions and adding the tasks and stuff. Overall still a great video.
Agree. Great video but for a beginner, formatting the cells went way too quickly.
You tube allows for playback down to 25% to 75% of normal.
Thank you so much for the vid again. I was able to generate a daily based version of the spreadsheet by following your tutorial, this is going to be mighty helpful
You're amazing! Thanks for sharing your knowledge. You're so kind.
Hello and thank you for this video. I am having an issue with trying to get the Gantt bars, the formula =K$4=(TODAY()-WEEKDAY(TODAY(),2)+1) comes back as FALSE. And I am also confused about whether I'm replacing the formula for the weeks in K4 with this one.
Great question, having the same issues.
Great question. Having the same issue.
The Gantt bar formulae need to be entered as Conditional Formatting rules. If you've created all the dates in row 4, and all the row data you are using in columns C to I, then you need to click on cell K6, then press Ctrl+Shift+End and it'll highlight the range of cells you are testing.
Up on the Home menu, click Conditional Formatting, New Rule... then select the bottom rule type "Use a formula to determine which cells to format", enter the formula in the box below, set the Format... you want. Click OK, then Apply, then OK.
Great video, yes I am having the same issue - please help
Stuck on the step around 9:40 - making it show a u when that date falls within the week selected above. the formula isn't showing any errors and appears to be pulling from the right places but I am not getting the u on the week it should appear (the end date is 4/30/2022 and it should appear in the work week of 25-Apr). I even tried changing the end date to match the week day exactly and it doesn't seem to want to work. Anyone have any tips / advice?
Hey, did you get an answer or resolve yourself? I also can’t get the symbol to appear.
manually add the formula, also do the fancy thing formula he said right at the beginning when he just start adding the day and month e.g., 22-Sep
Work Around: I inserted a Column for Week Number for the End Date and used this formula =IF($G5-WEEKNUM(L$4)=0,"u"," ")
best video, got praises from all of the team members, AWESOME VIDEO.
Great tutorial! Thanks for the clarity slow pace and disposition!
Hi David, great tutorial!
Do you know why excel returns "there's a problem with this formula", when I e.g. try and run IF(K$4=($F6-WEEKDAY($F6,2)+1),"u",""). The same also goes for the following formula when trying to add the gantt bars? Best regards
Try using " ; " instead of " , "
That worked for me
How can I download this
Work smarter not harder 😂😂😂
You save my life rn. This is awesome and beautiful how u made this
Thank you 😭
Awesome, brilliant, thank you so much, this is extremely useful for my personal study and work scheduling =)
I was following along fine and then once I got to the milestone integration and with the formulas I got lost. I have tried placing in the exact formula to no avail so I can't go any further with the GANNT creation. :-(
One thought: if you're not using the "fancy" start date formula, make sure your project date starts on a Monday. This should work with the rest of the formulas!
@@davidmclachlanproject I tried changing the start date to Monday and it still doesn’t work. It’s a shame I really like to look at this chart but I can’t go any further. I spent a few hours designing this and now I can’t use it
In my opinion, it is the best timeline chart I have ever seen. I need a help on the "Percent Done". The formula of the Percent Done on the Bar does not work for me: =AND($I6>0, K$4 = $E6 - WEEKDAY($E6, 2)+1). Shows an error. Help me!
I'm getting the same :(
same
He never responded did he?
I'm stuck on the same thing.
I think that's where almost everyone got stuck...is he going to respond on it or not?
had the same but resolved it this way:
Added a closing parenthesis for the WEEKDAY function before the +1 in the second argument.
Changed the greater than or equal to sign (>=) to just the greater than sign (>) in the third argument.
you made excel fun and beautiful! your tutorial is amazing! thank you!
Thank you so much for this wonderful Gantt chart.
You should explain the formulas as well in depth.. it made it very fast.. super difficult to learn for a beginner