I've been looking for a proper explanation on QTL mapping for months! Finally found one that tackled all important details and explained them clearly. Thank you so much!
You just SAVED MY LIFE! My professor just wasn't able to explain this In a way simple enough for us to easily understand, so we all just settled with the thought "Oh well, that question will be wrong in the exam then" but then one of my fellow students found your Video! Thank you so much!
I was originally hesitant about watching this video as it was displayed on paper. However, I am so glad I stuck with it, this is the clearest and simplest explanation I have come across! Thank you so much for your help.
Thank you so much!! All the other videos I watched to try to learn this left me more confused than I was in the first place but you explained it so simply!
A perfect and clear explanation. Can't find a better video like this. Maybe add how to calculate the probability score would make this introduction more complete.
Hey, How are you? i'm waseem, i'm doing PhD In functional genomics, my research project also involve QTL mapping and marker assisted selection of gene involving grain size regulation in Rice Crop. Your Presentation is really Productive, But i need more tutorials like this to carry out my project.
thanks!! I am doing my Master's research project this year, doing CRISPR editting on sub. clover. I was reading one my supervisor's paper about high density SNP linkage map to construct QTL , I was very confused about how it works, your video explains this clearly!
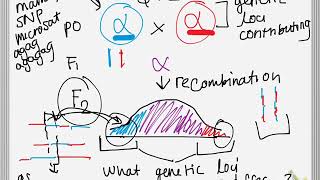
Thank you for the explanation. My one question is on why you cannot do QTL on F1. I would imagine there would be considerable variation in F1 since most trees are highly heterozygous. Is it simply because there are dominant effects that would cover up recessive alleles until F2?
In the F1 we have only the heterozygous condition i. e., all the F1 plants are having same genotype which is only heterozygous condition. But it is only in F2 we get all possible genotypes obtained due to genes segregation and independent assortment of all genes that are involved in the expression of each phenotypic class of a complex trait
That’s roughly it Umar. We are using pieces of DNA, microsatellites for example, as flags all across the genome to narrow down the area of the genome that is responsible for the phenotype we are studying.
But mam, You say 20cM but from where ? Means for eg. you say Marker M1 is locate 20cM have 60% chance to linked QTL but your measure distance 20cM is from which point ? Is it the whole interval of 2 flanking markers? Please clear my doubt
We could compare the parental genomes, but if we did there would be many loci that differ and we wouldn't know which was controlling trichrome density. By making an F2 generation, and getting a spectrum of the phenotype of interest we can narrow it down to loci that correlate perfectly with that spectrum.
Hi, nice explanation! Thank you! I only didn`t get one thing: how exactly probability score is calculated: one the basis of DNA sequencing through correlation of homology between two similar phenotypes?
Based on what she said, I think you may need calculated the correlation matrix of snp values among low density and among high density at each location.
Hi Korya, yes I think you're right. When your professor says "probe" I think he is referring to the genetic probes that bind to the molecular markers in the genome of interest. Each point on the graph at the end of the video represents a probe and its correlation to the trichome phenotype. So essentially, yes, I think he's asking you to find probes with high probability scores.
A SNP or "single nucleotide polymorphism" is single base of DNA that is different from the reference genome. For example most people may have a T on chromosome 1 location 10987. But you have a G there. That is a SNP. Many SNPs that are common in people have been named (rs333 for example) and they are collected on sites like SNPedia.com. Hope this helps!


I've been looking for a proper explanation on QTL mapping for months! Finally found one that tackled all important details and explained them clearly. Thank you so much!
Thank Jun! Glad I could help.
You just SAVED MY LIFE! My professor just wasn't able to explain this In a way simple enough for us to easily understand, so we all just settled with the thought "Oh well, that question will be wrong in the exam then" but then one of my fellow students found your Video! Thank you so much!
I was originally hesitant about watching this video as it was displayed on paper. However, I am so glad I stuck with it, this is the clearest and simplest explanation I have come across! Thank you so much for your help.
got the dummy thicc genomics exam in 5 hours, you're a blessing
5 years later and your tree example is saving me from failing genetics.
Thank you so much!! All the other videos I watched to try to learn this left me more confused than I was in the first place but you explained it so simply!
I was having a hard time understanding QTL mapping and then I found your video..Thanks
I also struggled with QTL analysis at first, which is why I made this. Cheers!
A perfect and clear explanation. Can't find a better video like this. Maybe add how to calculate the probability score would make this introduction more complete.
Very helpful. Well explained. Very rare videos like this are gound in youtube.
Such a amazing lecture..... Thanks a lot....love from INDIA🇮🇳
OMG, This is what i call an explanation, thank you so much!
You're very welcome!
Wow your explanation.. really helping me to understand better.. thank you .. make more videos like this .. 🙂🙂
Such a great explanation, very clear and concise. Thank you!
A very nice video. I enjoyed it a lot!
Thank you 7 years later!
Great and easy-to-understand explanation! Thank you so much.
Hey, How are you? i'm waseem, i'm doing PhD In functional genomics, my research project also involve QTL mapping and marker assisted selection of gene involving grain size regulation in Rice Crop. Your Presentation is really Productive, But i need more tutorials like this to carry out my project.
Hi Waseem, sounds like a nice project! What other tutorials would help you?
thanks!! I am doing my Master's research project this year, doing CRISPR editting on sub. clover. I was reading one my supervisor's paper about high density SNP linkage map to construct QTL , I was very confused about how it works, your video explains this clearly!
i dont know how to thank u..just thank u.. so much
finally something usefull, nice and at the moment that I need. THANKS¡¡¡
Nice video and very good explanations. Thank you very much !!!
Thnk u ma'am for clearing this concpt🥰🥰🥰
VERY HELPFULLY, THANK U SO MUCH
Thank you for your knowledge-sharing, which is easy understandable!
Thanks from Brazil! Such a great video!
Very clear explanation. Thanks!
Thank you so much, this is really clear and helpful!
you saved my life thank you so much
Excelente video, muchas gracias.
Thank you for the explanation. My one question is on why you cannot do QTL on F1. I would imagine there would be considerable variation in F1 since most trees are highly heterozygous. Is it simply because there are dominant effects that would cover up recessive alleles until F2?
In the F1 we have only the heterozygous condition i. e., all the F1 plants are having same genotype which is only heterozygous condition.
But it is only in F2 we get all possible genotypes obtained due to genes segregation and independent assortment of all genes that are involved in the expression of each phenotypic class of a complex trait
Thank you!!! it was a wonderful and easy explenation !
Thank you for the amazing explaination.
Thank you for this simple explanation.
amazingly explained, thank you
very helpful. thank you so much
Is it we select short portion of DNA I mean gene or upstream elements such as promoter etc and see for various which favour the trait.
That’s roughly it Umar. We are using pieces of DNA, microsatellites for example, as flags all across the genome to narrow down the area of the genome that is responsible for the phenotype we are studying.
Thank you Katherine
Thanks! You explained in a very understandable manner
it is crystal clear! Thanks a lot
Awesome explanation, thaaaanks
Thank you! Very clear and understandable!!! How can I get more videos such academics?
Thank you! so helpful and clearly interpreted!
Thank you. It is helpful
Clear and Useful :D thanks so much!
thank you so much for explaining simply
Thanks, super helpful and very clearly and simply explained
Thanks Sebas!
Is it easy to describe how to arrive at the 90% correlation for blue SNPs?
But mam,
You say 20cM but from where ? Means for eg. you say Marker M1 is locate 20cM have 60% chance to linked QTL but your measure distance 20cM is from which point ? Is it the whole interval of 2 flanking markers? Please clear my doubt
Why can't we compare the parental trees directly if the genomes are similar and only differ at locations associated with the phenotypic differences?
We could compare the parental genomes, but if we did there would be many loci that differ and we wouldn't know which was controlling trichrome density. By making an F2 generation, and getting a spectrum of the phenotype of interest we can narrow it down to loci that correlate perfectly with that spectrum.
Hey! I really apreciated your video content, helped me a lot!
Hi Gabriel, thanks! So glad it helped :)
Nice vedio....
Thankyou, Katharine!
Love it 😍
Thank you! 😊
Thank you. Very informative. Simple explanation.
Thank you gurumurthy! Happy it helped.
Clean and clear!
This helped a lot, thank you!
Hi, nice explanation! Thank you!
I only didn`t get one thing: how exactly probability score is calculated: one the basis of DNA sequencing through correlation of homology between two similar phenotypes?
Based on what she said, I think you may need calculated the correlation matrix of snp values among low density and among high density at each location.
Brilliant! Thanks so much.
Very nice video and good explanation, but "locuses" isn't a word. Loci is the plural of locus :-)
Such a great video
THANK YOU SO MUCH!!!
Glad it helped!
Thank you so much!
Very helpful!
great explanation!
Thank you very much
thanks, so much clear!
Fabulous.
Please can you help about explain this topics because Ian student and I have research in the QTL statistics
Thank You, really helpful
Hi Adam, thanks, I'm glad.
thank you so much
Thank you ❤️
thank you
Hi! i would like more information about QTls analysis in plants!
Hi Daniel! Is there a specific problem or plant phenotype you're interested in? I'd be happy to help.
So when my professor asks me to find a probe that has a 'strong QTL', what does he mean? High peak on the graph? :O
Hi Korya, yes I think you're right. When your professor says "probe" I think he is referring to the genetic probes that bind to the molecular markers in the genome of interest. Each point on the graph at the end of the video represents a probe and its correlation to the trichome phenotype. So essentially, yes, I think he's asking you to find probes with high probability scores.
thank you!
What the hell is a molecular marker?
what is a SNIP?
A SNP or "single nucleotide polymorphism" is single base of DNA that is different from the reference genome. For example most people may have a T on chromosome 1 location 10987. But you have a G there. That is a SNP. Many SNPs that are common in people have been named (rs333 for example) and they are collected on sites like SNPedia.com. Hope this helps!
Trichomes are "hairs" on leaves and not needles of pine trees ;)
Thanks for clarifying :)
@@KatharineME Welcome :)
Perhaps saying what QTL stands for would be helpful
Thanks for the tip kurtandjord :)
Thanks
Wilhelmine Hill
Martinez Brian Young Sandra Hernandez Sarah
Margarett Bridge
Langworth Turnpike
Better to read book than viedo
Harvey Landing
Clark Jennifer Harris Carol Brown William
Young Patricia Garcia Carol Harris Michael
ठँकु मैम
Thomas Gary Martin Christopher Miller Ronald
locuses
منك لله يا علوم
Thank you so much