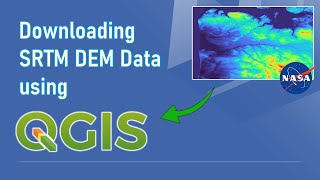
Downloading Digital Elevation Data (SRTM) from USGS EarthExplorer

HTML-код
- Опубликовано: 27 май 2021
- In this tutorial, you will learn how to download Digital Elevation Model (DEM) Data with a resolution of 30mx30m from USGS EarthExplorer web portal.
The type of digital elevation data demonstrated in this tutorial is SRTM, which stands for Shuttle Radar Topography Mission. You can download the following three types of SRTM DEM data from USGS EarthExplorer website;
1. SRTM Non-Void Filled
2. SRTM Void Filled
3. SRTM 1 Arc-Second Global (30m Global)
#usgs #digitalelevationmodel #spatialanalysis


I love your way of explaining in all your videos! Thank you Sir!
You are welcome :)
This is exactly what I was looking for, and super easy to follow. Thanks!
You're welcome!
The video really helped me out. While working on a project on GeoHECRAS I was able to extract HEC-RAS cross sections from the elevation data.
Can you explain how you you put your DEM data (elevation details) in the HECRAS software? If possible, can you please give your contact no?
Your videos are incredibly helpful. I'm learning a lot of the tools as a landscape architecture student and you explain things so clearly so that you don't leave us behind when we run into obstacles. I was able to use this video to generate a topo map for one of my presentations. Thank you and keep up the great work!
Hello, its great hear that the video was useful. Thanks for watching :)
Praise God for your life. Thank you for extending your skill and time just for us to learn this. God bless you.
Wow, thank you
Excellent! This has been a longstanding problem for me - getting contour lines in foreign countries to pursue my rail foamer plotting of new and upgraded passenger rail lines worldwide! Google Earth's elevations in the status bar are great but you're blind without contour lines to show the shape of things. I am very excited about this. Thanks so Much!
Hi, thanks for your comment. Check whether this could be of some help to what your looking for?
ruclips.net/video/MHuh4BxuR1M/видео.html
@@geodeltalabs Oh yes, I actually slowed it down at one point while trying to coordinate my actions with the video. I've now got it so I can run through the process in QGIS "fairly reliably" by rote.
I'm using 75m intervals (I know never to interact with GE while it's trying to load - it can load anything if you just leave it alone) and with that and the status bar figures it will make for increased avoidance of miscalculations. But I wonder: normally I calculate in feet in GE being in the US - because the result is 3.28084 x more accurate (ha, ha) but the starling thing is that the status bar figures corroborate VERY precisely with the old USGS Togoraphical Maps. Now if the tightest resolution of the (what is it?) "Year 2000 Satellite Survey" is 30m, then how is it Google Earth has such accurate figures in the status bar? I mean once I found a place it was MORE accurate than the USGS Topo Map - proven with Street View. (I expect surveyors sometimes got tired of being sick+tired back then, maybe they were doing some early experimenting with void filling.)
It may be the best solution for my purposes would be from your video where you extend a path at length in approx grid to get the GE figures, and create a file using ArcGIS. But haven't gone through even a quarter of your videos on the subject. Like I say yesterday's results are very encouraging, because lacking in coding knowledge I was pretty much stuck in countries outside the US as far as getting a concept of the lay of the land, for the past 10 years. Putting the exaggeration at 3.0 and viewing skewed and close really doesn't make for a feeling of confidence in one's proposed rail alignments.
Thank you for this tutorial, looking forward for AHP method in Landslide Susceptibility Mapping
Thank you, my teacher, for the video.👍
This was super helpful. Thank you!
Very educative detailed stepwise.Thank you
Great 👍
Really good stuff sir. Well done
Thank you so much, i needed this!
Glad it was helpful!
Thank You for this clear session. Actually, your tutorials are very helpful to me for my study. Thank You again sir.
Sir, Could you please make a session for the NDBI analysis using satellite image. Actually, want to know how we need to categorize the value that we gain from -1 to +1. There are many tutorial for the NDVI. But, I couldn't find the any tutorial about how to categorize the NDBI values ( like buildup, water bodies and vegetation)
Or else please suggest anyway to find the buildup area distribution for any place.
sir, It will really helpful for us
I don't know whether it correct to ask here.
Hi, as the definition of the NDVI suggests, it's a measurement how well (or otherwise) a certain element in nature reflects the near-infrared light and absorbs the red light (NDVI = [NIR-RED]/[NIR+RED]). Healthy vegetation which happens to contain more chlorophyll content, tends to reflect more NIR and absorb more red light, making the numerator of the above equation go high, indicating the presence of healthy vegetation.
Therefore, I would suggest that for general classifications of things like buildings , roads, urban areas etc, you may use a supervised classification method, and use NDVI only with an understanding on what it was meant for.
Hope this clears things up at least to some level :)
Sir, Thank You for the reply. I really got it sir.
Also I watched the tutorial about supervised classification for the Landsat 8 image that you uploaded year ago. You mentioned a band combination description table in that video. can I use that for any satellite image ?
Actually , I asked this question in that tutorial also sir, I couldn't get the reply for that.
I am a undergraduate student, very interested to learn Gis and Rs after watched your channel.
Thank You
@@kkethusha7666 Every Satellite image has a different band recorded by the sensor in recording individual bands, so Landsat 7 band combinations are different from Landsat 8
Thank you very much for the video! :)
You are welcome :)
Thank you so much...this video was very helpful
You are welcome! :)
Thank you so much, super useful video :)
You're very welcome!
Thank U so much.....Very helpful
Great service, thank you. I was hoping you can cover Llandridot Wells though 😊
Thankyou for your good lessons
You are welcome
Big big big thanks.
Thank You!
hello, I require a slight clarification. How do you get the 'height of water' for certain geographical coordinates, at a particular time when DEM is unavailable?
Thank you. Can you tell how to get correlation between dem data and LULC
thank you a lot,
How to incorporate DEM data(z value) for better accuracy in classification in arcgis?
Thanks dude
TYSM ILY
Many thanks dear
Most welcome
SRTM water body could be helpful for islands? Or its use is different?
Thank you
You are welcome
The kml file means the area of interest which is extracted from toposheet??
Thanks
Thank you for your swift explanation. Do I extract the geotiff data before loading into ArcGIS? Mine is not reading what I have downloaded
Always extract
Hi thank you for this vidio.can you tell how to get correlation between Dem and LULC
Is it possible to delineate a watershed and burn streams from a Sentinel 1 image (10 m resolution?)
Can you use QGIS instead of Arcmap?
where can i find elevation data for further than 60° north?
@GeoDelta Labs Your missing something... When I follow these steps and click the results button it says no data found.
When I drag my .tiff fil into qgis, it's not on the same place as I thought it would....
When is it advisable to use SRTM and IFSAR Dem? Is it depend on the size of your area of interest?
Higher the resolution, the better... As long as your PC is strong enough to handle it :)
Hi Sir, could I ark you a question, I download the SRTM with 30 m Res so I can't import to program like Geosoft montaj, do you have any idea for solve this problem ,
Thank you Sir
Bro r u using only qgis in ur all vids or there is vids of arc gis as well?
How to I get the map to show? And is it possible to get a satellite one
Hi
I had a question for you
Fortunately, your specialized channel has a high subscription, I wanted to know if only you produced a video and uploaded it to the channel to reach this number of subscriptions or did you do something else?
For my own channel, which started a few months ago and did not grow much, I needed to get information
Thank you for your reply
The simple thing you have to do is to produce short videos and essential tutorials. Thank you!
Is there a way to combine multiple elevation data into one file for a whole country? I basically want the elevation data of the UK with the land borders
Hello there, are you referring to combining multiple tiles of SRTM data into one continuous raster covering the entire UK? or blending elevation data from different sources? The former would be much easier. Once you download the tiles, use 'Mosaic to New Raster' tool in ArcMap to combine the tiles to one raster, or 'Merge' tool if you are using QGIS.
Can I use it in ArcGIS? kindly consider the question sir ..
Sir I am using this method for many years but now days, whenever I tried to download SRTM DEM, it shows no result found. Where as, except SRTM DEM, others items from the website can be downloaded.
Please help me....
Don't put any date range then check
Thank you. 😊
@@user-qy8zi8hq4v No it doesn't solve the problem... I Cannot click the results then
What is SRTM water body data?
Sir i learned how to download but how you add this file in Arc gis ..if you have video related to that kindly share link in comments
Please, I'm having issues with this. Did you later learn how to add it?
hello and thank you for your tutorial, I just had one question - when i drop the tiff file into qgis, it is never aligned with my basemap, and it is also much smaller in scale, do you have any advice?
What sort of ta basemap are you using? and in which software?
As i read one another cmnt that in qgis there is prblm occuring to be fit the satellite image on the same coordinates of the any other image so i will prefer u to use arc gis
Is it possible to download dem on the year basis?
ex : 2020 elevation data ,2021 elevation data.
I don't think SRTM is available for recent years just yet. You may check the metadata to see the existing version's year
Can you please help me with downloading DEM using USGS Earth explorer.when I downloaded DEM it is been downloaded as black shade picture.
same here
THERE IS PROMBLE IN LOGIN OR CREATING ACC
Can this app showing the cave underground? Or showing underground water?
Hi, no it won't. This shows only the variations in surface terrain
how do i add points
hi sir, please explain how can i download SRTM images of one location in time-based like 2000, 2010, and 2020 years images if available so.
not only SRTM, how can I get any past DEM images of an area
Hi, I don't think the elevation data are available for multiple years as you have mentioned. You could try checking the metadata to see what year the data you downloaded belongs to
some people take non void filled dem for process and fill the missing data
Sir my study area is located in Kashmir. Cud u plz help. Me to download DEM for my study area
Hi, during the first few minutes of the video you would be able to see how to locate the data corresponding to an area that is of interest to you. You could either zoom into it or upload a shapefile or a KMZ file whoch demarcates your area of interest and based on that you would be able to go ahead and download the corresponding DEM tiles.
any idea where to get some data for 2m res
I think data with such a fine resolution may not be freely available to download
@@geodeltalabs yeah, since this comment, i've found 1m DTM for england and 1m arc for US of A
Download option is not showing with me.
2:13
Why don’t they just made it available in bulk? Such a pain
You may check my video on downloading SRTM data using SRTM Downloader plugin in QGIS. Its one of the easiest ways to bulk-download multiple tiles at once, for a specified area
@@geodeltalabs I will thank you!