Variance - Clearly Explained (How To Calculate Variance)
US
Войти
Measures of Variability (Range, Standard Deviation, Variance)
9:30
Calculating the Mean, Variance and Standard Deviation, Clearly Explained!!!
14:22
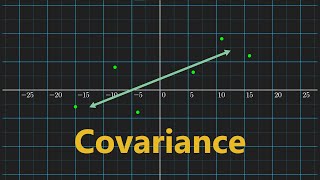
Covariance Clearly Explained!
7:47
Gas Fruit Is The MOST OVERPOWERED Fruit.. (Blox Fruits)
10:37
REBUILDING A PORSCHE 911 GT3RS FROM SCRATCH
45:52
The Battle Over NYC Congestion Pricing
21:51
Variance - Clearly Explained (How To Calculate Variance)
Steven Bradburn
Подписаться
106 тыс.
Скачать
Готовим ссылку...
Просмотров 186 тыс.
0
0
Добавить в
Мой плейлист
Посмотреть позже
Поделиться
Поделиться
HTML-код
Размер видео:
1280 X 720
853 X 480
640 X 360
Показать панель управления
Автовоспроизведение
Автоповтор
Опубликовано: 18 янв 2025
Комментарии • 135
Следующие
Автовоспроизведение
9:30
Measures of Variability (Range, Standard Deviation, Variance)
Daniel Storage
Просмотров 359 тыс.
14:22
Calculating the Mean, Variance and Standard Deviation, Clearly Explained!!!
StatQuest with Josh Starmer
Просмотров 488 тыс.
7:47
Covariance Clearly Explained!
Normalized Nerd
Просмотров 103 тыс.
10:37
Gas Fruit Is The MOST OVERPOWERED Fruit.. (Blox Fruits)
FoltynPlays
Просмотров 871 тыс.
45:52
REBUILDING A PORSCHE 911 GT3RS FROM SCRATCH
Mat Armstrong
Просмотров 3 млн
21:51
The Battle Over NYC Congestion Pricing
Wendover Productions
Просмотров 575 тыс.
22:55
I GOT BULLIED INTO CUTTING MY HAIR :(
KillSMartyr
Просмотров 211 тыс.
31:15
But what is the Central Limit Theorem?
3Blue1Brown
Просмотров 3,7 млн
7:41
What Is A P-Value? - Clearly Explained
Steven Bradburn
Просмотров 689 тыс.
10:24
How To Calculate Variance
The Organic Chemistry Tutor
Просмотров 1,5 млн
13:47
Variance and Standard Deviation: Why divide by n-1?
zedstatistics
Просмотров 281 тыс.
7:49
Standard deviation (simply explained)
DATAtab
Просмотров 1 млн
12:50
Statistics made easy ! ! ! Learn about the t-test, the chi square test, the p value and more
Global Health with Greg Martin
Просмотров 2,2 млн
28:33
What is the Riemann Hypothesis REALLY about?
HexagonVideos
Просмотров 621 тыс.
11:44
The standard error, Clearly Explained!!!
StatQuest with Josh Starmer
Просмотров 229 тыс.
12:34
Range, variance and standard deviation as measures of dispersion | Khan Academy
Khan Academy
Просмотров 2,4 млн
1:22:35
🔴 Пресс-конференция после UFC 311: Махачев vs Мойкано
UFC Eurasia
Просмотров 424 тыс.
02:33
ХРУСТНУЛА ЧЕЛЮСТЬ! Полный Бой Ислам Махачев VS Ренато Моикано UFC 311 / Islam Makhachev - Moicano
MMA review
Просмотров 139 тыс.
00:33
Кто яйцо держал дольше?
МЯТНАЯ ФАНТА
Просмотров 601 тыс.
34:47
😰Какое Аниме СИЛЬНЕЙШЕЕ в Майнкрафт? + Кабан
FixPlay - Майнкрафт
Просмотров 156 тыс.
00:19
andddddd STILL!!! Islam Makhachev finishes Renato Moicano in ROUND ONE 🏆 #UFC311
UFC
Просмотров 571 тыс.
00:59
你们怎么选?#火影忍者 #佐助 #家庭
火影忍者一家
Просмотров 27 млн
03:29
Каспийский Груз - Табор вернулся в город
Каспийский Груз
Просмотров 237 тыс.
15:10
Игра мечты ( MiSide )
JOHAN
Просмотров 475 тыс.