The standard error, Clearly Explained!!!

HTML-код
- Опубликовано: 29 июн 2024
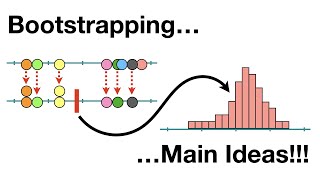
- This StatQuest explains what the standard error is and then it shows how it can be calculated with bootstrapping.
There is a minor error at 10:22: The bar that represents the mean is in the wrong location. It should be at -0.3.
For a complete index of all the StatQuest videos, check out:
statquest.org/video-index/
If you'd like to support StatQuest, please consider...
Buying The StatQuest Illustrated Guide to Machine Learning!!!
PDF - statquest.gumroad.com/l/wvtmc
Paperback - www.amazon.com/dp/B09ZCKR4H6
Kindle eBook - www.amazon.com/dp/B09ZG79HXC
Patreon: / statquest
...or...
RUclips Membership: / @statquest
...a cool StatQuest t-shirt or sweatshirt:
shop.spreadshirt.com/statques...
...buying one or two of my songs (or go large and get a whole album!)
joshuastarmer.bandcamp.com/
...or just donating to StatQuest!
www.paypal.me/statquest
Lastly, if you want to keep up with me as I research and create new StatQuests, follow me on twitter:
/ joshuastarmer
#statquest #statistics #standarderror


Support StatQuest by buying my book The StatQuest Illustrated Guide to Machine Learning or a Study Guide or Merch!!! statquest.org/statquest-store/
StatQuest is my favorite quest. Instead of getting a rusty dagger as a reward, I get knowledge of the eternal workings of the world.
Bam!
You are amazing! After watching this video, I just had to join your channel! I have never heard such a clear example of bootstrapping before and I have been struggling to learn stats for years!
Thank you so much!!! I really appreciate your support! :)
Josh can you do one video to explain intuitively the Degree of Freedom? thank you!
thank you so much for this!! ive been struggling a bit on my stats module but your clear explanation has helped me realise just how simple these concepts are once you can wrap your head around them!
Thanks!
I really appreciate all your effort onto your channel
Thank you! :)
Omg I should know these great tutorials earlier before I was asked a bootstrap question in my last job interview!!
Wow! Well, now you know all about it! :)
@@statquest Yes and it's still not too late. Thank you Josh!
I was sooo confused with standard error and bootstrapping method! but this video made my concept clear. Moving on to the next statquest - confidence intervals
Glad it helped!
This is an amazing intro to bootstrapping!
Thank you very much. :)
Awesome Josh! you are so helpful.
Thanks! :)
your so clear explanantion always saves my life, thanks a lot.
Happy to help!
this is brilliant! thank you!
Thank Josh for your great contribution.
Thanks! :)
Super helpful explanation! This is one of the best ways I have heard it explained. The sound went a little low in some parts, just FYI.
Glad it was helpful!
The best explanation on bootstrapping ever!
BAM!!! :)
Excellent and clear description.
Thanks!
Thank you for easy to understand explanation.
Thanks!
It was really "Clearly explained". Thanks a ton
Glad it was helpful!
Thank you. I’m kind of dumb and you make statistics easy enough for even me to understand!
:)
Brilliant! So intuitive.
Thank you! :)
Thanks Josh for this work, it's such an amazing collection of videos! They're REALLY clearly explained and easy to listen also for those who aren't mother tongue, suitable also for who hasn't a huge background on statistics.Have you released anything about xgboosT? It would be a nice topic to talk about!
Cheers from Italy
I'm working on XGBoost right now. It should be ready in the next month.
@@statquest That's nice, hope to manage to include in my master thesis
You are the best!!!
Wonderful video!!! I have immersed your channel. It is much better than pedantic books I have read. I got a question, I am wondering how do we get the formula standard error = sample standard deviation / number of samples by standard deviation of mean?
Unfortunately that would take a whole video to answer. :(
Thank you for making the video to explain the standard error! I have three questions, and I hope they dont look stupid -
1. When we calculate the standard error of coefficients in linear regression, do we use bootstrapping to calculate standard error or just the standard deviation of the error devided by the sample size? (In R)
2. What are the use cases of bootstrapping to calculate the standard error?
3. How do we interpret standard error in general?
Thank you for your time to answer them:)
for the third one i can say that the standard error can be interpreted as how far the sample mean is away from the population mean, less the sd the closer your data is to the population
Wow! Your explanation is so awesome! Making a dreaded topic like statistic palatable.
Thanks! :)
such a great video. thank you.
Thank you!
Where have you been 😢!! Ahhn, just tell me where have you been in 2001/2002/2003.
You nailed it ❤🎉❤
Thanks!
Great video. One thing I don't understand is how the "fancy formula" should be used or not used compared to boot strapping.
The fancy formula applies when we want to know the standard error of the mean.
thank you!
I don't know if it would provide another level of clarity, but maybe in some way relate that the way in which you're talking about the mean and standard error are in terms of "us" trying to estimate the population mean (mu) and population standard deviation (sigma). So the standard error is the estimate of the population standard deviation. Which can be generalized more to the average (x - bar) and the standard error are parameter estimates. This might be too in depth for your audience, but when I first watched your videos I did have trouble separating the ideas.
So, one thing you wrote is a little off: "The standard error is the estimate of the population standard deviation." The standard error and the population standard deviation are different. The standard error is an estimate of how the mean varies with repeated estimates and depends on the sample size. The larger the sample size, the smaller the standard error. This is different from the population standard deviation, which is constant, always. For more details on populations parameters, see: ruclips.net/video/vikkiwjQqfU/видео.html and ruclips.net/video/SzZ6GpcfoQY/видео.html
@@statquest You're right...Thanks for the correction. It appears subtle but are different entities. Would it be correct to phrase it as "The standard error is an estimate of how your parameter estimate varies and depends on sample size." ?
@@moneyman2200 Yes.
Great. Thank you Sir
Thanks!
Great explanation of standard error and bootstrapping. It did not become clear to me from the video *why* one would want to calculate them.
This is a really old video - one of the originals - and back then the idea was that people would be reading a paper or webpage and come across a term and this video would help them understand that term in the context that they found it. If I ever remake this video, I'll include much more context so that it is clear why the standard error is helpful. Spoiler: The standard error is used in many statistical tests.
@@statquest thanks for the quick reply, Josh. It was just something that came to mind, and would really make the video complete. I get why did you did not include it. Funny how these things develop, isn't it?
Got it! Thanks!👍
bam!
Thank you so much for the video. You are really doing a great job👏. I just want to ask a question that which standard deviation should be used in the formula (standard deviation/sqrt(n)) to calculate standard error of means.
Is it Sample’s standard deviation divided by square root of sample size?
Yep
Ohhh i missed this video.... Now i have completed watching it... MEGAAA Bammmm
BAM!!!!!! Hooray! :)
Please Tell how to calculate manually the standard error of the coefficients in multiple regression.
Great vid! BAM 💥!
Thanks!
You are my hero🤜🤛
:)
Thanks for this great video ! I still have a question. At 6:41 you calculated the standard error of the mean by calculating the standard deviation of the means, is it better here to use the real std or the estimator with the (n-1) term ? Thank you in advance!
Usually it's better to calculate the standard error directly (with the n-1 term).
Wow great! Finally, I understand the idea of bootstrapping! Can anyone suggest some straightforward program for doing bootstrapping?
It's super easy to do in R.
8:11 I will definitely read up on this fine point but just in case I don’t find anything clearly explained going through formulas in stats books - when you mentioned the standard error of the mean equals standard deviation of the underlying population (for the original normal distribution of the mice weights) divided by the square root of your sample size, does it hold true if the underlying sample is not normally distributed but follow some other random distribution curve (like Poisson, binomial, etc)? Thanks again and you really to a great job “clearly explaining” all these concepts! ❤❤❤
Edit: after reading some of your replies to previous comments it seemed that the formula does hold true for other types of randomly distributed samples?… Which would make sense from the central limit theorem (which is what brought me to this channel originally last night 😂😂😂) Just want to confirm that I did not mistakenly state this extrapolation…
Merry Christmas and thanks again!❤
Yes! Since the sample mean is normally distributed, and the standard error is the standard deviation of that mean, this should hold when the underlying distribution is not normally distributed.
@@statquestthank you so much for clarifying that! ❤
Great video! To calculate standard error, when to use the formula std-deviation/n^(1/2) versus bootstrapping? I guess if results are similar, why bother bootstrapping?
Thanks a lot, all clear now!
I have same question,could you explain it
@@janakicohen9231 it is used when there exists no formula, e.g. standard error of the median (instead of mean)
Thank you!
BAM! :)
Thanks for this wonderful explanation. Just one question, isn't the concept of standard error based on the Central Limit Theorem (I find it very similar) or the other way round?
The standard error of the mean is related to the CLT in that we have a simple calculation for it.
Hi Josh, thank you for the nice video! I see you mentioned the standard error of mean is SD/the square root of (n) here. I would like to understand this a little deeper. For binomial distribution proportion, the standard error is the square root of p(1-p)/n. For poisson distribution rate, the standard error^2 is either N*Lambda or Lambda/N based on what I found online. What is the difference between these two answers? Which one is correct? Thank you very much!! I really appreciate your help, BAM!!
n*p(1-p) is the variation for a binomial distribution. If n=1, then the variation is p(1-p) and the standard deviation is square root(p(1-p)). And thus, the standard error is sd/square root (n) = square root ( p (1-p) / n). So the formula you listed is correct and consistent with the concept that the standard error = sd / sqrt(n).
Brilliant !
Thanks!
Hello!
I recently found your awesome videos while trying to remember the concepts seen in my statistic course last year.
I wonder why we can't just use the formula of the standard error of the mean (s/√n) to estimate every statistiques?
Thank you for your videos!
The mean is normally distributed (see this video on the central limit theorem: ruclips.net/video/YAlJCEDH2uY/видео.html ) and that helps gives us such a simple equation.
Your explanation is superb👍
But I'm really I interested in how you can just calculate standard error using just one sample mean's standard deviation? And why it's calculated the way it is. Because in your video, it seems that in order to calculate standard error you need multiple means. Or if explanation is too involved, is there any resources you think is better covered? Thanks in advance!
Due to the central limit theorem (see: ruclips.net/video/YAlJCEDH2uY/видео.html ) we know that all means are normally distributed - and we use this information to calculate the standard error.
Awesome video! One question though. The x axis is plotted as difference from the mean but why? Can't we take absolute numbers and make calculations?
We use the square to calculate variance and standard deviations because, ultimately, it makes the math easier. Squares a differentiable at all values, and the absolute value is not.
Subsamples are permutations and not combinations, meaning that we might end up having subsamples like 12345 and 54321, which both have same Mean. So not only measurements in subsamples can be duplicate, but also entire subsamples can be duplicate. Did I get it right?
yep
Sir what is 1 Standard Deviation & 2 Standard Deviation in 3:43?? Please have a word... and thank you so much for these 10 min videos... really helpful.
See: ruclips.net/video/rzFX5NWojp0/видео.html ruclips.net/video/vikkiwjQqfU/видео.html ruclips.net/video/SzZ6GpcfoQY/видео.html
thank you for the video! I finally understand the concept! Im wondering why you not introduce the formula? because Im searching from z statistics, so feel a bit disconnect and confusing..
I guess I didn't feel like the formula was the important thing since it's automatically calculated for you in excel. Instead, I wanted people to understand what the result of the formula represented.
Please create a video about Ljung-Box test!
I'll keep that in mind.
Does standard error make sense with non-normal distributions? Given that sd is computable for any distribution, I was wondering how the interpretation of SE carries over when we've got asymmetric and potentially multi-modal distributions.
The mean of any distribution (with a mean) is normally distributed (see ruclips.net/video/YAlJCEDH2uY/видео.html ) so the standard error the mean still makes sense.
@@statquest, super, thanks, I half expected this to be the answer. Nice to hear from you. Just another quickie (if you don't mind) - is bootstrapping to attain a distribution of sample means to compute a SE preferable over computing the SE from the 'textbook' SE formula? i.e. population s.d. / sqrt(n) where we would have to make the assumption that population s.d. = sample s.d. (assuming a large sample here of course).
@@Singleentity101 The textbook formula is fine, but it only works in certain situations. The bootstrapping solution works in a much wider variety of situations, so it's a very good trick to know.
Thanks for the great video! One question at 6:14: you described how to calc (standard error) standard deviation of sample mean. But can I also calc it in this approach:
1) only draw ONE set of sample, x_1, x_2 .... x_n,
2) then calc s^2 = sum(x_i - E[x_i] )^2/ n
3) then calc s/sqrt(n) = standard error
is above statement correct? Thank you so much!
yes
@@statquest Is there any video where you explain the logic behind calculating SE from only one sample data? Thanks
@@mikeljimenez3598 Part of the logic comes from The Central Limit Theorem: ruclips.net/video/YAlJCEDH2uY/видео.html
@@statquest Thanks for the link! I understand part of the logic comes from the CLT, I was wondering whether the relationship between SE and CLT is specifically explained in any of your videos, it might be an interesting topic for a future video. Thanks for the great videos and content.
In bootstrapping we randomly picking up the values from the sample and then calculate the mean. Is the mean calculated from the random values not cause any issue while calculating the standard error as we are not calculating the mean from the original sample values?
I'm not sure I understand your question. We can calculate the standard error by calculating the variation in the bootstrapped means.
Hi Josh, A question please.
The video describes two ways of getting the standard errors (let's say, of the means).
a) Get many means from samples of the population, and work out the standard deviation.
b) Bootstrapping: get many means from re-sample sample data.
But aren't they two different things: (a) is based on samples from the WHOLE population, while (b) is based on resampling of ONE set sample data?
They are two different techniques that result in the same value for the standard error (at least, asymptotically). In other words, bootstrapping, by being so easy to do, and yet gives us the same result as something that is hard to do, is a little bit like magic.
@@statquest Thanks, Josh. But does bootstrap work given it's sampling only a set of sample data points? I guess it works only under certain conditions, e.g. the number data points in the set is large enough, the sampling is repeated large enough time?
Btw - wishing you a Merry Holiday and Happy New Year!
@@karannchew2534 Bootstrapping works, but the sample size must be large enough to make a large number of permutations of the data (I think 8 is large enough for this to be possible), and then you take 1000s of permutations.
@@statquest Got it. Thanks!
Savior as always! Triple baam!!!
Thank you!
at3:14,you calculate every sample for mean and standard deviation, I wonder the denominator of the formula in respect to standard deviation is "n" or "n-1"?is itself standard deviation or estimated population standard deviation?
In this case, we're estimating the population sd, so we use n-1.
@StatQuest with Josh Starmer At 6:49, I believe all standard deviations are calculated as square root of sample variances of each of the sampling, and standard error is calculated as the square root of the sample variance of means. If so, at 8:11, the standard deviation / square root of the N should not be equal to the standard error calculated using samples. The former is the true standard deviation of a normal distribution to which the sample mean will asymptotically approach, the latter is the estimation of the parameter using samples. Am I correct here or I get myself confused? :)
I'm not sure I follow your logic, so I could be missing something. The standard deviation of a whole bunch of means, estimated from a whole bunch of samples, is approximated by the standard deviation of a single sample divided by the square root of the sample size. They are not equal, but they approximate each other. Does that help? I'm not sure it does.
@@statquest My bad, indeed. I always believe, if one cannot state the question clearly, he must be totally confused. In this case, It is me. :) I took a calm-down shower and back to restate the question. :) So ..., you stated that there will be a lucky case that standard error can be calculated using formula. Otherwise, bootstrap is there for rescue. May I say ... if one needs to calculate (approximate) "standard error of means", the lucky formula is the right choice, due to central limit theorem. For other standard errors, bootstrap is the choice.
@@jtbauer3789 Ah, now I see. Your calm-down shower was effective. I believe what you wrote is correct. My only hesitation is that there may be some other clever formulas for other standard errors out there - but excluding those rare (and possibly non-existent) occasions - bootstrapping is the choice. It's just so easy and works so well.
I wonder why it's called error. Must be some magical logic behind it
Error refers to the difference between what we predict and what is true.
Awesome video!
I have a question: here and elsewhere people are saying you can use bootstrapping for statistics other than the mean. I've tried doing it for variance though and got a horrible roller-coaster looking histogram. Does this happen when the original sample is too small?
I'm not sure. You could test this by selecting a lot of sets of observations from a standard normal distribution and plotting a histogram of the variance of each set, then compare that to a bootstrapped version.
@@statquest great idea, thank you! Will let you know what happens.
@@statquest I'm planning on doing a more thorough write up, but here are a couple of simple simulations of estimating the variance of a Normal distribution with mean=50 sd=10. For the first plot, 1000 independent samples were taken from this distribution. For the second, a single sample was taken and then resampled. The dots show the variance estimated from the single sample, the lines on the distributions show 95% CIs given by quantiles. As you can see, the bootstrap distributions do look fairly normal, so I have no idea where the weird result is coming from in my own data!
imgur.com/a/n4oOQYs
@@ellenpasternack9750 BAM!!! Those graphs are totally awesome. Thank you for sharing them with me. I think it's interesting that even the bootstrapped variances with sample size = 10 are normal. So cool Thanks again!
Thanks
bam!
Great video :-). Do you by chance have any R code for the bootstrap sampling you showed at the end of the video?
Let x be a vector containing measurements and n be the number of measurements you want to sample.
bootstrap
@@ai1888 thank you!
Hi, Josh, in 2:23, it said the y axis refer to the proportion of the mice. I am confused. I guess in any distribution gram , it is the area inside the distribution or curve , that can reflect the proportion.
What you say is true - the area under the curve tells you what proportion of stuff is between two values. I was a little sloppy with my language and over simplifying.
@@statquest Thanks for your reply , Josh:) I learn all these from your videos. Respect!
@@statquest I still don't understand what you meant by proportion of the mice.
@@sohamdhas8589 To understand what I mean, check out this StatQuest that explains the normal distribution: ruclips.net/video/rzFX5NWojp0/видео.html
@StatQuest with Josh Starmer
I have a doubt ! Please answer me !
(I'm learning this for machine learning and data science ). I've been following your statistics playlist serially as it is available. Till this point , I only have one doubt that sampling a distribution means selecting a small cluster of data points from the whole sample and do experiments on them .
Is it similar to cross validation like our model is evaluated on different set of data so that it is more generalised . Similarly if we have large amount of data even these computation and graph plotting will be heavy tasks for computer so therefore we experiment on small datasets because it will be very good approximation of generaized or whole population because it's been proven by statistics (as you have shown in these videos) hence working on subset of the large datasets won't affect our end results ?????
Are my interpretations correct? If not please correct me !!
How large are you talking about? Usually computers are very fast and can do a lot with a lot of data so it's not a problem.
@@statquest my main question is experiments done on sampling dataset (small subset of large dataset ) and the conclusions drawn from that will be the same as experiment perfomed on whole dataset ?
@@pritamrao3256 It depends on how large the small dataset is. The larger the dataset, the more accurate the estimations.
@@statquest thank you !! It cleared my doubt your videos are wonderful !!
Can you put some p-value corrections explanations ?
I read in many papers about bonferroni corrections and sometimes for me its hard to think what statistical test they performed to test significance (Most of the time they mention the test). Also is adjusted p-Value same is corrected ?
Your videos are really helpful, thank you.
Can you please elaborate on the rare case when you can use the formula (s/sqrt(n)) to estimate the standard error? Almost every other video or text I read uses the formula exclusively in every case.
The rare case is when you want the standard deviation of the means. If you want the standard deviation of anything else, like the median, you pretty much have to use bootstrapping.
@@statquest I see! Thanks for getting back to me. Really appreciate it! :)
Hi, what happens if we calculate the standard error using all 25 measurements at once instead of 5*5 measurements(stad. err of 5 means with sample size of 5)
I'm not sure I understand the equation. Why would you want to do that?
I'm pretty sure you are tired of hearing this, but your work is amazing! I have a question though: in which case do you think ist wise to represent SEM as error bars? I'm my field normally we work with 3-5 replicates and in case we repeat the experiment several times, we only report one experiment's data. Still, a lot of publications show SEM as error bars, which makes no sense to me after watching your video. Is just people not enough aware of statistics or am I missing something?
In my opinion, I think it's a mistake to draw the SEM because hardly anyone knows how to correctly interpret it. That said, it really depends on what you want to say with the data. Usually we want to get a sense of how variable the data are, so we use standard deviations - but if you specifically want to talk about how precise the estimate for the mean might be, then the SEM might be OK. Just make things are clearly labeled and maybe add a note saying that the bars reflect the estimated mean and not the spread of the data.
@@statquest Thanks for the response! Does it really make sense to show SEM when only one set of measures have been taking? (having three biological replicates for example). After all, the SEM estimate wouldn't be very robust, right?
@@Chaman2892 It really depends. Sometimes 3 measurements is all you can get - it just costs too much, or is too risky or takes too much time. So you work with what you have. That's one big lesson I learned when started doing statistics "for real". In theory, 3 measurements is next to nothing, but in practice, sometimes it's all you have so you just do your best.
2:26 - Can someone please explain what does proportion mean intuitively? Maybe with example.
You can think of "proportion" as meaning the same thing as "percentage". The larger the proportion, the larger the percentage.
@@statquestthank you
At 8:17, what is the case in which we can use the formula? It would be helpful if you can elaborate on it.
Generally speaking, the standard error of the mean (as apposed to the standard error of the variance or some other thing) is just the standard deviation divided by the square root of the sample size. You can use that formula any time you need the standard error of the mean. (NOTE: This works for any mean, regardless of the distribution it comes from. This works because of something called "The Central Limit Theorem")
@@statquestI am confused! How is 'the standard error of the mean is just the standard deviation divided by the square root of the sample size'. Can you please explain? I will be very thankful to you!
@@peshalgoel7414 I can't derive the equation in a comment, but, intuitively, you can imagine that the more data we get, the more precise our estimate will be.
@@statquest Thank you so much for replying. If I exactly understood what you are implying, I think it gives rise to yet another question, that why not divide it by 'just the sample size' rather than 'square root of n'.
@@peshalgoel7414 Again, I can't provide you with the derivation in this comment, but I guess the estimate gets better, but not that much better... However, do you know R or Python? This would be the perfect thing to test in a computer program, where you could generate a bunch of random samples of size, say 10, calculate the means, and the standard deviations of the means. Then generate a bunch of random samples size 100, calculate the means and the standard deviations of the means. The second batch should be about sqrt(100)/sqrt(10) (which is approximately 3) times better. Here's the R code:
n
Amazing..
Thanks a lot 😊
Hi Josh.
At 5:07 we have 3 samples with 5 measurements in each. Total 15 measurements.
If all 15 measurements are independent then we can also say that we have 5 samples with 3 measurements in each, right?
And so calculate another SE using 5 means with sample size 3. So there would be 2 different Standard Errors.
Shouldn’t we reckon that measurements in different samples are not totally independent? I.e. "sampling group" matters cause each sample is supposed to be taken in its conditions (scientists, time, tools).
And SE actually measures the variance between different sampling conditions?
You can mix and match, but the accuracy of the estimated mean depends on the number of samples used to make the estimate. So if you use 5 measurements, you will have a more accurate estimate of the mean than if you used 3. This is why "sample size" matters. See: ruclips.net/video/VX_M3tIyiYk/видео.html
@statquest It seems i finally got it
At 8:13 you mention rare cases, but could you explain what those rare cases are and when the simple formula applies?
*Please correct me if im wrong*
The rare cases are the ones where we know the Sampling Distribution of our estimator.
For example, by the Central Limit Theorem we know that the Sample Mean follows a Normal Distribution. Under this scenario, we can derive the "simple formula" he mentions in his video.
Example, for the Normal Distribution, mean of the sample means -> population mean, variance of the sample means -> (sigma^2 / n).
For the Variance of the sample means this is because Var((1/n) sum of X_i to X_n) = Var(X) / n.
If the distribution were skew then the standard error might not be equal on both sides of the mean. But even then, if we knew the exact distribution we might be able to work out the standard errors.
The formula applies when you want to know the Standard Error of the Means. You probably have set your mind to link the term 'Standard Error' to 'Standard Error of the Means'. But what if you wanted to know the Standard Error of the Medians? Or the Standard Error of the Mode? You couldn't use the formula as you'd use for the Standard Error of the Mean. That's why the formula is limited and you can only use in 'rare' cases (It doesn't matter the variable distribution, you can use whenever you want the Standard Error of the Means). Other cases that you have a formula to use include: Standard Error of the Sample Proportion, Standard Error of the Difference Between Means and Standard Error of the Difference Between Proportions. On the other side, you could use the bootstrap method for anything, like Standard Error of the Standard Deviations, Standard Error of the Modes, Standard Error of the Mean, Standard Error of the Medians, Standard Error of the Variances, and so on.
Agree with Douglas. One more point - for means, because we have CLT, we can use data's standard deviation/sqrt(n) to estimate standard error of mean. But for other statistics, if you want to measure standard error, you need to use bootstrap!
There is also a formula for calculating the Standard Error of Measurement: (SD of the sample) * Sqrt (1 - Reliability of Scale)
Can I do bootstrapping if I have n observations and 1 run only? Meaning I can skip the step 5? Say my measurements are temperatures and they are 10.4, 10.0, 10.2, 10.3 and 10.1. That's just it. I want to know the standard error. Is it valid when I take the sample standard deviation of these and divide by sqrt of 5 to get the standard error? Meaning, I just treat those data points as mean already. Is that valid? Thanks! :)
I'm not sure I fully understand your question. If you have a collection of data, you can calculate the standard error directly from the data, or you can use bootstrapping.
Well, another explanation of the meaning of variance and error of the mean, but no one explains where the formula for the error of the mean is derived from. Does it exists rigorous mathematical proof of the formula SEM = SD/sq.root of N ?
Presumably this is derived from the central limit theorem.
Again, so nicely explained but then there is a formula SE= Std dev/sq.root of total no of observations. Am I correct , @StatQuest with Josh Starmer ?
yep
So the samples of size N is the same size as the original sample but with replacement?
Yes, that is correct.
@@statquest thx
great video but at 08:07 it is confusing. "The good news is... the standard error of the mean is one". bit lost at at that point
In that context, what I meant was "There are a few situations where there is a formula calculating the standard error. The standard error of the mean is one situation (or 'a situation') where we have such a formula." Does that make more sense?
@@statquest yes many thanks, that does make sense.
I think I'm right in saying that, generally speaking, if we are lucky enough to know the population standard deviation, we can use that in our standard error calculation and ultimately then go on to use the Standard Normal Distribution to draw some conclusions about the population... whereas in contrast, if we do NOT know the population standard deviation and we instead rely on the SAMPLE standard deviation in our standard error calculation, we must turn in stead to the "t-distribution". The latter is more often the case in real life, unlike text book questions.
@@spearchew Yes, the t-distribution has "fatter tails" that reflect the uncertainty we have in the estimate of the standard error. That's why when we have a small sample size (and thus, low confidence in our estimate of the standard error), the tails in the t-distribution are much fatter than than normal distribution. However, as our sample size increases, and our confidence in our estimate of the standard error increases, the the tails in the t-distribution get thinner and start to look exactly like the normal distribution.
@statquest If we calculate mean of same data cluster, again again it will same, then how can we do bootstrapping here , confused?
The bootstrapped samples are different because we can select the same number multiple times. For more details, see: ruclips.net/video/Xz0x-8-cgaQ/видео.html
But can you calculate the standard deviation of the standard deviation of the standard deviation?
With bootstrapping you can.
At 10:22, why'd you put the orange bar on the positive side? Clearly, the mean of those five numbers is negative. Also, there is no value for the unspecified fifth point (the right-most point) that would make the sample mean 0.2 and make the sample standard deviation 1.923 as you indicated at 3:12. Am I missing something? Great explanations otherwise.
1) You caught a little typo.
2) When you bootstrap, you make a new sample that is the same size as the original sample, only you can pick the same value more than once. In this example (at 10:22 ) I picked 1.43 twice, which means that there's no room in the bootstrapped sample for the right-most point. However, we have to make a lot of bootstrapped data sets, and some of those will contain that right-most point. Others, like the one in the example, will not. In general, about 1/3rd of the points in the original dataset are omitted from each bootstrapped data set. Does that make sense?
I'm confused. At 6:30, the standard deviation of the three means (-0.2, 0.633, 0.52) is 0.452 not 0.86. What am I missing?
Sorry for the confusion! The two "dots" between 0.633 and 0.52 indicate that there are additional values not shown on the screen. So my calculation of the standard deviation includes those extra values.
@@statquest haha. I don't know why I didn't notice the dots. Thanks.
@@alexblake5743 :)
So if my std. deviation is 1.619 then 68% of the data is spread around that vaule?
If the data is normally distributed, 68% of the data should be within one standard deviation of the mean.
Why do we need to do boostrapping?
You don't have to do it. You can use any measurement of the standard error. One advantage to bootstrapping is that it works in any situation.
how did you calculate the standard error[i.e the standard deviation of the sample means?like how u got 0.86.Really confused in that step]Please reply asap.Thanks
Just use the std deviation formula and take the mean and use the mean values as data values in your formula
Calculate the standard deviation, and then divide by the square root of the sample size.
stat! QuesT!!!!!!!!!!!!!!!!!!!!!!!
bam!
Also standard error tells how far each sample mean is from the population mean right.So standard deviation for each mean is calculated which means there should be separate standard errors for each mean.I am not getting how you calculated the standard error value in this video.For separate standard errors the fomula(s^/rootn) can be used but here since you didn't show the calculations for each standard error of the sample mean,how you calculated the standard error as 0.86
No std error is distribution of means around the mean of the means
This is correct. However, the mean is an estimate for the population mean so it is related.
Thank you!
I think I'm wrong.Sorry,it doesn't tell how far each mean is from population mean.It tells how far each mean is from the mean of means right?Please do clarify.I have an exam tomorrow
This is correct. However, the mean is an estimate for the population mean so it is related.
Just waaao!!!
I've seen some people get the error of the mean with just one sample. How is that possible?
By sample do you mean 1 measurement, or one collection of measurements? (I admit, I often use the term in a vague way that can mean either). If you mean the former, then I'm not sure it is possible. If you mean the latter, then you can calculate it directly with an equation or by using bootstrapping.
@@statquest well I guess I was just confused, I saw many people get it directly from one equation I guess that's what got me confused..thanks!..
I'd be cool if you said that all these are estimators
Noted
What is the formula to calculate the means of means. Thanks
(mean_1 + mean_2 + ... + mean_n)/n
@@statquest here since we have not yet calculated the mean of means, and only know the std error, then with the given mean, std dev and std error how to calculate the mean of means. Please explain.
@@neerajgupta1251 I'm not sure how to calculate the mean of the means in that context and, as far as I know, it's not done. When we just have a single sample, we can calculate the standard error (the standard deviation/sqrt(sample size) and use that with our estimated mean (rather than a mean of the means).
@@statquest but as per your video it is not correct to use the std error with mean of the single sample.
@@neerajgupta1251 In the video I say that you can calculate the standard error with a single sample at 7:59
Does proportion of mice tell us that 40% of them weight close to mean?
What time point, minutes and seconds, are you asking about?
2:37 - when y-axis is labeled as proportion of mice on the graph
i am yet to find a single video or source that says what standard error bars are, not a single soucre
I'll keep that in mind.
for the bootstrapping what if i only have 5 data or five sample measurements? isn't it giving the same mean everytime? what i do
If you only have 5 measurements, then you have 5^5 = 3,125 different means you can calculate. That's not a ton, but it's not a worst case scenario either. I think some people say that 8 measurements is the minimum you should have. For more details, see: stats.stackexchange.com/questions/33300/determining-sample-size-necessary-for-bootstrap-method-proposed-method
StatQuest with Josh Starmer Thank Josh! Haha 😆 I got you.. so I can generate random sampling based and my data by using a minimum of 8 or 10 sample... I learn lots of thing from your channel... keep up the good work! 😍🙏🏻
Anyone know what it means conceptually to calculate the standard error (SE) of a single sample (of sufficient sample size) if SE means the spread of many hypothetical means around a population mean? Assuming you don't know anything about the population.
Even when you don't know anything about the population, the means that you calculate from samples are always normally distributed (see: ruclips.net/video/YAlJCEDH2uY/видео.html ), and this makes it possible to calculate the SE from a single group of measurements.
but.. why bootstrapping works?
neural network clearly explained ?
I'm working on it.