Excel 2013 Statistical Analysis #09: Cumulative Frequency Distribution & Chart, PivotTable & Formula

HTML-код
- Опубликовано: 1 янв 2015
- Download files: people.highline.edu/mgirvin/A...
Topics in this video:
1. (00:09) Overview of % Cumulative Frequency
2. (00:42) Formulas to create Cumulative Frequency Distribution and % Cumulative Frequency Distribution.
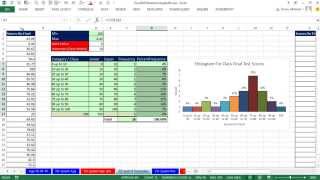
3. (04:17) % Cumulative Frequency (Ogive) Chart using X-Y Scatter Chart
4. (07:36) PivotTable to create Frequency Distribution and % Cumulative Frequency Distribution.
5. (10:30) Combine Chart that shows Frequency Distribution as a Column Chart with No Gap width and % Cumulative Frequency as a Line.
6. (11:43) Custom Number Formatting to hide all values using three semi-colons


Excel 2013 Statistical Analysis #09: Cumulative Frequency Distribution & Chart, PivotTable & Formula
Download files: people.highline.edu/mgirvin/excelisfun.htm
Topics in this video:
1. (00:09) Overview of % Cumulative Frequency
2. (00:42) Formulas to create Cumulative Frequency Distribution and % Cumulative Frequency Distribution.
3. (04:17) % Cumulative Frequency (Ogive) Chart using X-Y Scatter Chart
4. (07:36) PivotTable to create Frequency Distribution and % Cumulative Frequency Distribution.
5. (10:30) Combine Chart that shows Frequency Distribution as a Column Chart with No Gap width and % Cumulative Frequency as a Line.
6. (11:43) Custom Number Formatting to hide all values using three semi-colons
Good morning and thank you very much.
Mike always the best videos I have ever seen, number one guru in excel. The best talent in teaching I have encountered. Thank you, Mike, one more time Excelling, awesome delivery, and great explanations.
Thanks for the kind words, Rodrigo!!! Glad this Cumulative Frequency can help : )
thanks! you teach it right!
some very useful chart technics !!! helps a lot
and one of the best series about statistics as I thought
Glad it helps : ) Thanks, DIGITAL COOKING!!!
Thank you!
Thanks!!!
I wish you all a good day.
At 04:45,
the correct formula in cell G7 is:
=IFERROR(G6+C6,0) '
and in cell H7 it is:
' =IF(ISNUMBER(E6),E6,0) '
As in the previous comment.
Greetings.
I wish you all a good day.
At 01:45,
the correct formula in cell C7 is:
=IFERROR(C6+$D$4,$D$4) '
this formula evaluates the sum of the top cell + the value of cell D4 (the increment), if the top shell is not a number (as it is in this case) the sum gives error (the top cell (C6 is text) then instead of doing the sum just puts the initial value of the increment.
This way the formula is the same in all cells when expanding the range.
Greetings.
Translated with www.DeepL.com/Translator
Thanks
You are welcome, clifford!!
Hi, is there any ways to group the data in different amount? Like say I got a range of data from 0 to 1 million. But I would like to group them by; 0-100, 101-500, 501-10000....etc
How come it jumps from 250 to 275 in the last combo chart??
sdvef fwvee There are no values between 250 and 275. Doesn’t change the chart so I guess it’s ok. You can tell at 7:42 there is no difference between the cumulative frequency of $250 and $275.
are the upper limits inclusive?
Exclusive (up to). See his last video where he explains this. I wondered that at first also.
What is the '&' for after the "
& is the join operator. When you need to join two items so that they become one, you use &. Further, to have criteria like Less Than or Equal To a Number, you must have something like "
Hopefully you will click Thumbs Up and Subscribe to help support this free resource : )
Ohh... that cleared it up! Thank you for the explanation :) Your videos are very useful! Keep up the good work. Cheers!
Done, and done :)
Thank you - it is because of consistent support from viewers like you, Madhura Taskar
, that allows me to keep going : )
I dont think Bill Gates is that good in Excel!
Thanks!