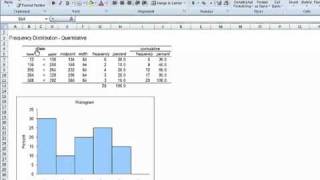
is this also known as 'ogyf?' my teacher keeps saying were ganna do polygon and ogyf and histogram on the test.. but... im not entirely sure which graph hes referring to with that. my closest guess is this one? and then polygon.. would look more like mountains?


![Understand Frequency Tables, Cumulative & Relative Frequency in Statistics - [7-7-3]](http://i.ytimg.com/vi/Md2_E_hTvdQ/mqdefault.jpg)


12 years later and it's still helpful..thank you...first year stats ..it helps
That's what's great about Stats .... it never changes :)
Thanks for your clear explanation!!!
Glad it was helpful!
Yes
Glad it helped!
Thank you
Glad it was helpful
amazing . lifesaverrrrr
is this also known as 'ogyf?' my teacher keeps saying were ganna do polygon and ogyf and histogram on the test.. but... im not entirely sure which graph hes referring to with that. my closest guess is this one? and then polygon.. would look more like mountains?
no one responded for 10 years damn