How to plot particle size distribution curve by hand

HTML-код
- Опубликовано: 7 сен 2024
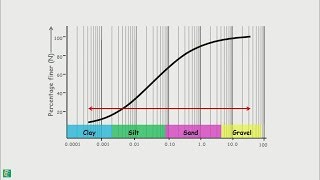
- In this video , I will show you how to plot particle size distribution curve by manually on semi-log graph paper, determine the coefficient curvature and coefficient of uniformity and how to interprets the values for construction purpose.
Learn how to do sieve test calculation • How to do sieve analys...
how to read a log scale
• How to use a semi-log ...


Remember to hit the like button if you appreciate my effort...
thanks i have my finals tommorow and this was helpful
thanks i have a test on this tomorrow found the video in the perfect time
I'm glad it was helpful
Mine is today😅 and it's an exams
Thankyou verymuchsir❤
@@pavandushan1238 You're welcome
Tmrw is ma midterm n I needed this thanks bro
Glad it was helpful
@@MagmaUpwelling Welp thanks again I've passed that class n now came back cuz I have a HW n apparently I've forgotten everything lol so yuh thanks for everything prof
Thanks for this video. It's helpful
Thank you 🥺
God bless 🙏🏾❤️
I'm glad it was helpful
How can we find the area under the curve so we can get the average size of the particles
Thank you🎉
Thanku