Drawing Particle Size Distribution Curve

HTML-код
- Опубликовано: 7 дек 2018
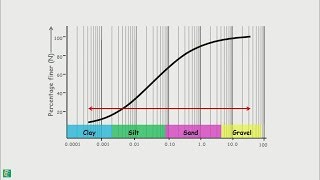
- This video is about the complete guideline for drawing particle size distribution curve, the most important part in sieve analysis test.
Visit "CivilFerba" official website:
www.civilferba.net  Наука
Наука


Thank you! This helped me a lot and fixed the problem where my titles were in all the wrong spots.
Glad it helped!
This was a very good lecture. Thank you for the upload!
Glad to hear this :)
Thank you for this video! It really helped my homework and lab report look neater!
Saved my life! Doing this for my research.
Thanks a lot! 🖤
same.. I was scary to start cause didnt knew where to start...:DD but now I did , great
You are welcome :) happy to hear from you
Glad to hear this :) Congrats
This Lecture is very helpful to me.
Thanks a lot!
Most welcome!
This was so helpful, Thank you, I love you, sending good vibes
Thanks brother very well explained.
Very informative and detailed! Thank you very much. 💕
Glad for your fedback, thank you
This video is so helpful!
Thank you so much. You very well explained.I understand everything. Thanks again :)
You are welcome :)
Very helpful and clear, thank you!
:) You are welcome
Very Informative. Thank you so much
Thank you so much for teaching this! It helped a lot for my project :))
Glad it helped :)
Thats exactly what i looking for, thx for the video, appreciate..
Glad I could help
exactly what I need. Thank you !
Thank you :)
Thanks for the brief, Regarding the display of D60=XXXX , D30=YYYY and D10=ZZZZ , we can make it a dynamic display in case of the change of values obtained as a result of the change in sample. CONCATENATE(D60 CELL, "=", "PARTICLE SIZE VALUE CELL")
Yes, the whole sheet is dynamics, change any value, the sheet recalculated based on new data.
Thank you very much. regards from #Iraq
Never mind, :)
it worked brother, i have been looking for this. thank you so much.
Glad I could help
Thank You Very Much For The Explanation Sir.
Thank you so much for introducing me how to draw the chart! I didn't know how to figure out D10. Thx a lot
D10 can be found by the same way as you use for D60 and D30, basically D10 is equal to the diameter corresponding to 10 percent of passing of total material, you just need to extend a horizontal line on 10% on vertical access, then extend till that line intersect with the curve, then drag the line at the intersection point till the line intersect the X axis, at that point you can read or interpolate the Diameter, which so called D10.
@@civilferba Yeah. What I learned from your lecture is how to use "trend" function. If you didn't tell me to use that function I couldn't have finished my geotechnical engineering hw.
It was so practical and helpful for me.
Thank You.
:) You are welcome
Thank you very much! Super helpful!
:) You are welcome
Thank you so much!!
thank you so much man
VERY GOOD LECTURE NOT ONLY TO DRAW SIEVE ANALYSIS . HOPE TO SEE FROM YOUR END A LECTURE ABOUT CONCRETE MIX IN SAME CRITERIA.
We will upload a video in near soon
Saved my day. Thanks a lot
Glad it helped!
Fantastic video, very helpful
Glad it was helpful!
Thank You , Nice Lecture
Thank you :)
thanku bro
Thank you!
You're welcome!
fantastic job brother!
:) Glad to hear from you
Thanks
this is very helpful
Happy to help
Very helpful, thanks
Glad it was helpful!
Thank you!!!
Never mind mate :)
13:04 my line at the right hand side? I want the line at the left hand side...How can i solve this problem?
Hi, you mean your vertical axis is on the right hand side? so check back my video and I already did it. watch the video from 3:05
@@civilferba thanks...
Thank you so much
You are welcome :)
thank you
You are welcome :)
There is sth slightly wrong about this
Trying to find D60/D30/D10 you use Trend function which is basically linear, however, our chart here is Logarithmic
Results are a tiny little bit different which can be ignored for this one but I'm not sure about the other cases
Great content btw !
thank you !!!
You're welcome!
nice vid, thx
You are welcome mate :)
Amazing!'
Thank you! Cheers!
Thanks..
You are welcome :)
Hi engineering thank you
How u calculated percentage of the particles?
Greater than 4.75 mm = Gravel
Between 4.75 mm - 0.075 mm = Sand (all sizes coarse to fine sand)
Smaller than 0.075 mm = fine (Mixed with clay and silt)
excellent work
Thank you
what does percent of passing mean?
Percent passing mean mean the percent from total test load (material) which pass through a specific sieve.
Awesome
Thank you
oh cool, i need to do it for 35 samples....
:)
Legend
Thank you :)
why the sound is disturbing?
Sorry for the sound, it was a noise coming from computer fan, this is our first video, that is why there was some noise problem, sorry for this, we try to fix it.
แก๋ว