The Pressure-Enthalpy Diagram | Part 1: Theory

HTML-код
- Опубликовано: 20 сен 2017
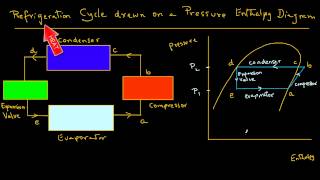
- The Pressure-Enthalpy Diagram is perfect for graphical representations of states of fluids. It allows to show, how thermodynamic processes are working with changes of states. That's the main reason for its widely usage in refrigeration and heat pump business.
This video part shows you, which type of information is contained in those diagrams.
chapters:
00:18 - Why?
00:34 - The Axes of the Diagram
01:51 - Specific Enthalpy h (Isenthalpic Line)
02:14 - Pressure p (Isobaric Line)
03:13 - Between the Axes
04:02 - The Two-Phase Domain
05:17 - Temperature T (Isothermal Line)
05:54 - Specific Volume v (Isochoric Line)
06:22 - Specific Entropy s (Isentropic Line)
Diagrams generated with "CoolPack":
www.en.ipu.dk/Indhold/refriger...  Наука
Наука


excellent explanation. Never come across such wonderful explanation of an important and critical concept of hvac.
Thank you soo much for this! After seeing everything on there own it's pretty self explanatory. Teachers should take print screens of your video to put on their lectures!!
Exactly what I've been looking for. A million thank-yous.
This video is amazing. Thanks for sharing. Very educational.
Vow....what a grate explanation....grate animation technique used..
Thanks a lot
Excellent ❤❤❤👏👏👏👏👏
Thanks a lot mam
Thanks a ton
amazing
Thanks
Thank you. I’m having a hard time with constant entropy. Am I right to think that it’s in a complete phases change to vapor or liquid and only sensible temp is increases or decreased in pe diagram only in vapor state?
Correction at 3:40. It is vapor and not gas.
nice 👍🏻
Thank you. It is very easy to understand. Where to find the Part 3, 4, etc in english version.
Thanks. I beg for the visual permission that you made me use in my learning activities.
Awesome video. Can I ask, in what software did you make this please? Id love to learn it. Many thanks.
Video description says the software used is CoolPack. It gives a link.
So you don't use the terms superheat and subcooling?
Your asking the real question!
Jeeze, your AI isn't very I! Lol