Qualitative Data Analysis

HTML-код
- Опубликовано: 6 июл 2024
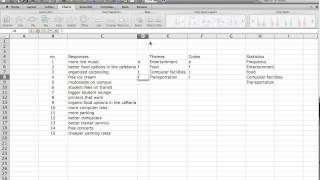
- Qualitative Survey data refers to the open ended questions where respondents could respond with text (not numeric) answers. This tutorial explains the 5 step process for analyzing qualitative questions.


I have gone through this video today, it has really helped me on how to get %s from qualitative data!
Thank you so much Dr.
you literally saved my life!!!!! best teacher so far
Thank you so much for sharing this video with us Dr. Taylor. I am working on my Chapter 4 for my research to obtain my masters. I have implemented your knowledge on coding my data following APA 7 standards … my research implements qualitative method (open-ended questions). Thank you! 🙏🏻❤️ This is mom writing: Tamara
I am glad that you found this helpful! Congratulations on getting your Masters!
Very useful resources. Thank you very much Dr.Taylor.
Hi Jennifer,
Thank you for the great tutorial! I was wondering do I need to open a new worksheet for each question?
Thank you very much for this video. I learnt a lot from it.
Great and helpful...thanks
Really goood
thank you Jennifer for this amazing tutorial. please how can I connect with you. i would really appreciate a one on one discussion about finalizing my analyses please
This is insightful. Thank you, @Jennifer Taylor. PhD
Shame that the tutorial cuts..... as I think this is what I am looking for.... Thanks for posting this tutorial on Excel as I find it extremely useful for my masters degree dissertation! Thanks once more!!
Dan
xx
I had a 15 minute limit on the videos due to the screen casting program I was using. Essentially you create the frequency percentages across the bottom and then you create an excel chart. Sort the data from smallest to largest (or largest to smallest if you prefer) so that your chart is in ascending or descending order. I plan to redo these videos this summer, but that might not be to late to help you.
This is a very basic qualitative analysis, meant for open ended questions on a survey. If you are doing a more advance qualitative study, then this is not the analysis that you would be using. It just isn't rigorous enough. Let me know if you have any questions or would like some citations for good qualitative analysis technique books.
@@JenniferTaylorPhD Hello there Dr Taylor. Yes, I think this video is useful for the gathering of my data of the questionnaire of 24 questions likert system, and 4 full opened questions. But on the 24 questions they also mentioned some characteristics that I think it is important to add them onto my final results. I have just finished doing it to 30 people. I have seen other videos where you need to break down question per question, and with your system, I find that, I can do them all in a shorter period of time, and achieve final results quicker with less steps, 5*! My thoughts are, I will be using your system and add a pivot table in order to continue doing charts, graphics, etc for this masters degree in data analytics and marketing. Would you mind if I put you on my references?
Many thanks!!
Dan
xx
@@danip113 Sure, just cite the RUclips Tutorial. I am very glad to hear that these are helpful. Good luck with your dissertation!
@@JenniferTaylorPhD Thanks a million!!! I will be looking forward to seeing your new refreshed tutorial of this video this summer! Thanks once more. Dan
xx
@@danip113 link me when it's online
Hi Jennifer, I was told that graphics are not recommended in qualitative data analysis. Rather, I was encouraged by my professors to run a thematic analysis. What are your thoughts on that? If the participants' motivations are pretty much not being considered outside of binary responses (continue vs increase), shouldn't this question be a multiple choice one? In other words, what is your rationale for the method chosen and the format for your question? Tks for clarifying.
Hi Karis! Thank you for your question. Without understanding the context that your professor is referring to, I cannot really offer an opinion. This issue is that there are a multitude of methods for qualitative data analysis and which method is best depends on the research question and the data collection methods (open ended survey questions, interviews, focus groups, etc.). In the video I present a very basic thematic analysis that is used on open ended questions from online surveys. A more rigorous thematic analysis is not necessary in this instance, as the research is descriptive and we are not trying to develop theory. Additionally, this analysis is not for qualitative data that has been collected as the sole means of analysis. In this case, the basic thematic analysis is simply adding to the story that the quantitative data tells us. The type of data analysis I present may be used to identify future measurement items (survey questions and categorical answers). It is important to note that thematic analysis, by its nature, is about binary coding - either the data exhibits the theme or it does not. When you have a survey question and you identify several themes of answers, you can use graphics to show these themes. However, it can be argued that it is subjective and thus the percentages obtained will reflect bias and error, which is why many do not recommend using graphics. My perspective is that the graphics add value when conducting descriptive research - such as surveys/questionnaires that include open ended questions. I would not recommend using this method to those who are using qualitative data as a sole means of research whose aim is to be published in an academic journal. Hopefully this helps :)
Best of luck to you!
Hi dr, thank you so much for the video. Is there any way to analyse direct from SSPS? or excel is the only way? And last question. Let say im using excel to analyse the qualitative data, there is two answer answered by the one respondents. For eg : Strict rules & supervision regarding worker usage of safety. Should i create another new column (strict rules & supervision) or simply just insert in the separated (1. strict rules) (2.supervision) column in thta i made in the excel ealier?
Thank you for your comment. This video is used as a tutorial in my undergraduate class, where learning Excel is one of our learning objectives. That being said, you could do this in SPSS by simply adding a variable column for each theme and using dummy codes (1 or 0) to indicate that the theme is present or not present. You could create a frequency chart and copy it to excel to create a chart or create a chart in SPSS. To answer your second question, sometimes respondents can mention multiple themes in an response. In those cases you would have separate themes, but add a count (1) for each theme you see in the data. I would also like to mention that this is a very basic analysis, if you are working on a dissertation where you collected qualitative data through interviews, then you may want to look into using a platform like Nvivo, which does a much better job in allowing you to code rich data. Good luck analyzing your data and please let me know if I can be of any additional help!
Kind regards,
Dr. Taylor
@@JenniferTaylorPhD thank you so much for providing such a very good info, im gaining new knowledge today 💜!
Thanks in a million.
thank you so much
What a great explanation! Your video is very precise and straight forward. By any chance, do u have a video on how to put these findings in the report?
Hi did you find any resources on this?
@@waynemwangi9444 unfortunately no
hello Dr. Taylor. I am wondering about the method you have used in this video. What method did you use to analyze qualitative survey data?
This would be a simplified version of a thematic analysis. I say simplified because this is what I teach my undergraduate students. If you are doing a thesis or dissertation, then you would want to learn more about thematic analysis because there are a few more steps involved that I do not include in this video.
Hello Jennifer. I found your video very interesting. I have a question: How could I clean data if my question is "Explain your problem (with any of our services)?"
I work for an university and we have lots of services (food court, payments, enrolling, parking, our mobile app, enrolling for classes, health care).
I don't know how to classify this data for type of service to report it to the corresponding area.
Thank you in advance!
Hi Israel! Thanks for your question. If you asked one open ended question and the answers could fall under multiple service categories, then I would do the following:
1) Create a column for each of the service categories that are mentioned by resondents (ie., food court, payments, enrolling, parking, mobile app). Essentially these service categories become "themes" - but they are "higher order themes" in that you will create subthemes underneath them. Due to the nature of the question, you might find that a respondent provides feedback for multiple service categories (maybe they talk about the food courst, parking and the mobile app). Simply code a 1 in each corresponding column for the service category.
2) If you are using excel, you can create a new worksheet for each service category and copy and paste the respondents answers that you coded as mentioning this category. Then, assuming you have enough responses, go through an identify any themes that you see in the data (for example maybe those responses that mentioned food court talk about things like slow service, cleanliness, etc.). Themes are a way to summarize data, so if you don't have enough responses to identify themes, then in your report you can just report the distinct issues that were mentioned and you can report those verbatim.
I hope this helps!
Good luck with your project :)
thanks doctor
thank you
Hi there, can anyone help? Can those be added in spss or how this works
Thank you janniiferrrrrrr my girl 😍
Can you please share the datas
if we do have a large data such 1000 above do we have to go one by one? is there any formula to do it faster?
Hello Taleb! Great question. There are a couple of options, but it depends on the software you are using. If you use a qualitative analysis software like Nvivo, then you can have it run a content analysis for you. If you are using excel, then things get more complicated. It seems that you would need to do a subsample of your data adn run it as shown, making sure to identify the key themes, plus identifying keywords for each them, then run a Qlookup or Countif for the keywords you identified. I recommend a qualitative software for the amount of data that you have. Nvivo has great tutorials to help.
@@JenniferTaylorPhD i am using excel workbook, I want to ask, Nvivo is it subscription software or free one? I am willing to learn it to do my work correctly
@@talebbagazi1435 Nvivo is a bit costly, but here is a great link to some free options: guides.library.illinois.edu/c.php?g=348074&p=2346107.
@@JenniferTaylorPhD woww thank you so much , this software don’t need for coding am I right?
I really appreciate your fast responses as well 🙏🏻🙏🏻
@@JenniferTaylorPhD one more question if the text not in English can the software Nvivo solve it?
Hi mam kindly let know how you frame questions of Qualitative tool if im using spss for analysis
Qualitative Questions are open ended questions that allow the respondent to freely write out their answers. SPSS will classify them as a String variable, which means that you cannot run any real mathematical analysis on them. However, you have several options for analyzing these questions - most of which do NOT use SPSS. To use SPSSS, you will start by reading through all the responses and identify general themes that multiple people mention.
Create a dummy variable in SPSS for each theme that you identify. Then code your data by giving each case a "1" if they exhibit the theme or a "0" if they don't. Then you can run frequency analysis on each variable you create. If you are not sure how to run the frequency analysis and how to create charts - then watch my Multiple Response Nominal variable video to see how b/c the dummy variables are essentially a multiple response nominal variable that you have created. I hope I answered your question. If not, please let me know and I will gladly help!
How to decide if I should use quantitative or qualitative
Quantitative is when you have numbers or text scales that can be given a numeric assignment, Qualitative is for text. Typically, open ended questions like "What could we do to improve?" are qualitative. Questions that are open ended, but have numeric answers, such as "How many times have you visited our store?" are considered ratio data because they have zero as an option, and are quantitative. I hope this helps!
Can I use closed ended questions for qualitative research by using likert scale?
Um confused