Это видео недоступно.
Сожалеем об этом.
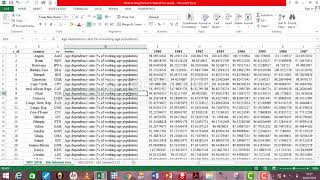
(EViews10): How to Import (Panel) Longitudinal Data from Excel

HTML-код
- Опубликовано: 1 апр 2018
- This brief hands-on tutorial shows how to import a longitudinal panel data file in Excel format into EViews.
Here is the link to the engee2.xlsx dataset used for this tutorial (endeavour to have a Google account for easy accessibility): drive.google.com/drive/u/1/fo...
Follow up with soft-notes and updates from CrunchEconometrix:
Website: cruncheconometrix.com.ng
Blog: cruncheconometrix.blogspot.co...
Forum: cruncheconometrix.com.ng/blog/...
Facebook: / cruncheconometrix
RUclips Custom URL: / cruncheconometrix
Stata Videos Playlist: • (Stata13):Estimate and...
EViews Videos Playlist: • (EViews10):Interpret V...


RUclips recently changed the way they monetise my content. My channel now needs 1,000 subscribers so it would be amazing if you show your support by both watching my videos and subscribing to my channel if you haven’t done so already. Monetising my videos allows me to invest back into the channel with some new equipment so a small gesture from you will be extremely huge for me. Many thanks for your support….CrunchEconometrix loves to teach, help me stay online.
subscribed madam. Thank you very much for your lectures.
God bless you for your subscription, Rajeev!!!! 💗🙏
Words are not enough to thank you. You're a great teacher. You have a wonderful voice for teaching.
Hi Uchenna, I'm humbled and encouraged by your positive feedback. I'm poised to do more for the academic community. Please may I know from where (location) you are reaching me?
Very well explained and helpful video
Thanks, Mikeakap for the encouraging feedback. Deeply appreciated 🙏🥰
its the second time that you saved my life! God bless your life!
Hahahaha, good to know, Daiane...thanks!
You are the best I ever Seen on RUclips in économetric vidéo. I don't speek english ...if not it would be so perfect for me! Thanks you
Thanks for the encouraging words and feedback, Yawo! Deeply appreciated! Please may I know from where (location) you are reaching me?
Saving me so much time and suffering, thank you !!!!
You are welcome, Mutantbuzz🥰
You just saved me, OMG this was so easy i've been trying for hours, Thank you sooo sooo much!!!!
U're welcome, Anastasia❤️. Please may I know from where (location) you are reaching me?
Thank you very much. It really helped me to make my assignments
Wow!!! Awesome...good to know, Askari. Please help share my link and tell others too. They need to know about my RUclips channel. I have easy and quality tutorials :)
Good teaching with warm and clear voice
I'm glad you find this video helpful! 🥰
Yes very helpful. I ran into a problem "near singular matrix" while running my regression. Any advice on how to solve this will be appreciated. Thanks.
That's the evidence of MULTICOLLINEARITY. I have videos on what to do. Kindly search 🔍 within my Channel and watch them. Thanks
Really it helped me a lot..!! Thank you so much
Glad to be of help, Saiful! 💕 😊 Kindly share my RUclips Channel link with your students and academic community on social media for awareness. They'll learn some useful tips and skills too!
very helpful prof as always. Happy 2023
Thanks so much for your encouraging words, Sir. Deeply appreciated!🥰🙏
Thank you a whole lot!
U're welcome, My😊. Please may I know from where (location) you are reaching me?
Thank you so much for these valuable videos , you are the best
Thanks so much for your encouraging feedback, Sir 🙏🥰
You're doing a really great job, kudos 👍
Thanks Sheriff, for the positive feedback and remarks on my video. Deeply appreciated! Please may I know from where (location) you are reaching me?
Kwara State, Nigeria
Awesome! I'll appreciate it if you can share the link to my RUclips Channel with your friends and academic community. They will find the content helpful too 😊.
This is so very enlightening. You start from the very basics of showing us how our panel data should be arranged in excel - I kept searching on how to do this until I watched your video. Thank you so very much. Please do you also have a video on how to create dummies and put your data in logs because the data you used were in logs and also had dummies. Thank you so very much once again.
Thanks Angie, for the encouraging feedback. You may want to watch my videos on dummy variables to know the procedure.
Thank you , just helped with my dissertation
Glad to hear this! Congrats on the success ahead! 💞
This, is great!
Thank you.
U're welcome, Asabea. Please may I know from where (location) you are reaching me?
@@CrunchEconometrix I'm in South Africa.
Thank you so much for the help! Peace
U're welcome, Kaz! 💕 😊 May I know from where (location) you are reaching me?
@@CrunchEconometrix I am From Morocco! And as a young African researcher, I am so happy and proud of you and your video tutorial!
@@zakariachtouki6642 Accolades humbly taken, Kaz!😄 I'll appreciate if you can spread the word about my videos to your students, friends and academic community in Morocco 🇲🇦 for awareness. They'll learn some useful tips and skills too...thanks 😊
Best tutorial video ever!Helps me a lot!
Hi Mia, thanks for the positive feedback on my video. Deeply appreciated! Please may I know from where (location) you are reaching me?
@@CrunchEconometrix I currently live in Belgium :)
Awesome!!! Kindly share the link to my videos with your students and academic community in Belgium... Thanks!
Thank you so much! you help me
You are welcome, Meg! 🙏 ❤️
THANK YOU THANK YOU THANK YOU!
@TheLeakyCauldron, you are very welcome! May I know from where (location) you are reaching me?
@@CrunchEconometrix all the way from Pakistan!! :))
@@CosmoExplosion Awesome! I appreciate it if you can share the link to my RUclips Channel with your friends and academic community in Pakistan and beyond...thanks 😊
Please make video download raw data and transpose pannel data
Ok, thanks.
Could you please make a video on semi annual panel data, how to import from excel and how to declear panel id and time
I have videos on all these. Kindly check my Panel Data playlists. Thanks.
@@CrunchEconometrix Madam, There is no such video, Suppose, if the time is semi-annual like
2000 - first six months
2000- last six months
2001- S1
2001 - S2
..........Cont...
How to declare time set and panel id
@@CrunchEconometrix Madam Share you mail id i can send you the data for you better understanding
Watch my videos on SUB+SAMPLE ANALYSIS and adapt to your work. Unfortunately, I refrain from personalized tutoring due to time constraints and my busy schedule. My apologies 🙏
Thank you
U're welcome, Sir.
Amazing skill you have
Thanks Nabeela, for the encouraging words. Deeply appreciated!
You deserve it really
I wanna talk to you personally
Let's keep it here. My apologies, pls. Thanks.
@@CrunchEconometrix I m also a lecturer as well as researcher.thats why
Very nice explanation ma'am. How to test stationarity of panel data ma'am.?
Hi Varnesh, thanks for your encouraging feedback. Deeply appreciated! 🙏. Kindly watch my videos on Contemporaneous Correlation, PCSE, and FGLS.
does the dummy variable is mandatory for a regression analysis?
Shihab, using dummy variables is study-specific.
Hi, I have a question on how did you create the dummy variable for years?
I do that in Stata.
Greetings! I would like to know "ID" can be input as "character" (instead of "number") and "year" can be input as "date" (instead of "number"). As I tried, the results are the same regardless of those settings, are those interchangeable?
Hansol, you may post your queries on an EViews platform for more constructive feedback.
hello, is it possible to see the impact of trade in the specific country?
Cindy, your query has no relevance to this video tutorial. You may need to re-post on the appropriate thread.
How are you dear Dr. Ngozi .. sorry Dr. I need your help I'm doing panel cointegration analysis and I'm using the estimation of parameters in DOLS annually for the long run for conventional banks and islamic banks to compare .. but the problem is an error message in DOLS that ( no valid observations after removing the cross sections ... ) so I can't run it .. only the way that I can run if I make lag method is none ..
So please help me ..
Hi Zad, unfortunately I can't say much about DOLS technique because I have never had cause to use the procedure. Sincere apologies...thanks.
Thank you for the video. How do we prepare Excel Panel Data File (for EViews 10) if there are different countries, than different commercial banks in those countries, that have different total loans amounts (dependent variable) per observed years in relation to GDP growth rate as independent variable?
Hi Ksenija, concerning your data structure, watch my video on "Building a Panel Data". It will be a helpful guide. May I know from where (location) you are reaching me?
@@CrunchEconometrix Hi! I will do that... (a Serbian) from Austria...
@@macro_finance U're awesome, Ksenija! 💕 Thanks for sharing! 😊
@@CrunchEconometrix Unfortunately, I am still confused... what I would like to understand better is the role of identifiers in excel before importing into Eviews 10 ("Building a Panel Data" video is for Stata)... In my example, I should have one "c_id" identifier for each and every country, and than (maybe) another "b_id" identifier for each and every bank in the relevant country - and how do I assign the numbers than in "b-id" identifier (if needed)?
Identifiers are unique numbers for each panel in the data. It is the way by which Stata recognises your data as a "panel data". For your data, you will have to sort by banks then create the identifiers.
Pls can you also lecture on time series
Hi Solomon, I have time series videos in EViews and Stata. Kindly browse through the Playlists. Please may I know from where (location) you are reaching me?
@@CrunchEconometrixOK, thanks Dr. I'm reaching you from Kaduna, Nigeria
💞
Deeply appreciated, Arup!💗🙏
Hi, I am about to run my analysis. But for my data, I stacked the years in a descending format that is 2018-2008 rather than 2008-2018. Will this be a problem? Thank you.
Not at all. But I will advise you sort them in the right way. Lowest to higher years.
@@CrunchEconometrix Thank you. I did from lowest to highest.
In your video lgini contain negative number is it okay? positive number can use log isnt it? I am asking because i also wantto know how to use log in negative number too
Yes, it is ok in this instance because the raw Gini coefficients range between 0 and 1 and you get negative numbers once they are transformed to logs. It is different from when you log raw negative variables, such will simply drop off, and you lose data points.
thank you :)
thank you always... :)
Hello, I have a dataset in excel of 4k companies (along rows), and the ratio's for them organised per column, e.g. ebit 2010, ebit2011, and so on. In total I have 4k rows and 74 colums. Can I just import this dataset into eviews as panel data without manipulating the excel file first? Because adding 10 year colums to each company row is an unsurmountable tasks seeing that I have 4k of them. Thank you
Hi Dimitri, the arrangement of the dataset from its source is very key since you have a large data. Each 4k coy should have its corresponding variables along the rows too and the respective years in column. Even at that, you will need to do some preps in Excel b4 exporting to EViews.
@@CrunchEconometrix Thank you for your reply, so I have to rearrange my data for eviews to recognize it as panel data? My dataset looks a bit like this: the rows are companies and colums are different variables (about seven of them) as Return On Assets, EBIT, these have each 10 colums i.e. ebit2010, ebit2011. So how do I reorganise my dataset in that case? I also have to mention that other colums are present with different kind of info (no separate years) like, location, size in number of employees, etc..
Do you have a specific video about that or can u tell me which manipulations in excel exist which avoid having to do this manually for each company seperately?
I understand, Dimitri. I do have a video that shows the preps but it's from Excel to Stata. See "Reshape longitudinal data".
@@CrunchEconometrix Yes I have watched that on your channel, unfortunately it couldnt help me with my specific query. I'm trying to see if maybe another program or eviews itself has a solution for this. Meanwhile I want to thank you for your swift responses.
when i get to step 4 it is not recognizing that it is a dated panel. Any idea why?
James, I suggest you watch the clip again. Thanks.
When I import the file and at the last step click Finish. An Error Message apear "Unable to determine date structure of source". Do you know how to fix that.
Hi Drump, you should not encounter any hitch if you followed the steps as shown in the clip.
@@CrunchEconometrix Thank you. I have solved my problem already. My data is so big and there are some typing mistakes when i import it. Btw, thank you very much.
Did you not skip the first stage in Eviews where you have to create a new workfile first before importing? The import window does not come active without creating a workfile first
Yes...I'm glad you understand the procedure.
@@CrunchEconometrix The problem is I am failing to do it. When I try to import all the figures appear in Eviews as "NA"
@@cornydube You can also open a workfile and drag the excel worksheet unto it. Thn you set the necessary parameters: select balanced panel, indicate start and end years, no. of cross-sections...and you follow the rest prompts. It's not complicated at all.
@@CrunchEconometrix I think there is something wrong with my data. I click next first the digits appear and by the time I get to declaring the panel specifications, the digits would be NA
I have a question: If i am using 6 countries for comparing with 18 years for each, how many dummy variable should I have?
Are you creating year or country dummies?
I am not sure which one would be better. I am analyzing bank performance indicators and as a dummy i thought to take countries that had a crisi or didnt (1,0) do you think one is enough, and am i doing this right?
Honestly Anastasia, you need to understand your study to know which dummy to create. Also, see similar studies to know what they did.
I HAVE DAILY DATA IN PANEL FOR 5 YEARS OF OF 30 COUNTRIES FOR 3 VARIABLE HOW CAN I IMPORT?
Hi Ramsha, I addressed your query in this clip. Select "balanced panel" during configration.
@@CrunchEconometrix thank you
Mam' can you upload some videos on details of 1. POOLED OLS 2. FEM and 3. REM. All in details example. with different types of estimation procedure applied, their application, details of diagnostic checking etc. We look forward for your great contribution to this academic world... Thanks for all what you have done so far...Its wonderful
Hi Purna, thanks for the positive feedback but you CANNOT get "detailed" on ANYTHING on RUclips but if you follow my tutorials you will be better off. I have videos on Hausman test, FE, RE, and the "reg" command yields OLS. Diagnostics are not required.
Thanks for your prompt reply. I have watched your videos on above mentioned topic, but they are not sufficient. I mean, how to check cross dependence in Pooled OLS, how to solve them if they have that problem etc....Anyhow I look forward for it. Thanks once again for your great contribution with 100% clarity...
irene njagi