How to interpret the results of KEGG pathway analysis?

HTML-код
- Опубликовано: 6 июл 2024
- #interpretation #kegg #pathway
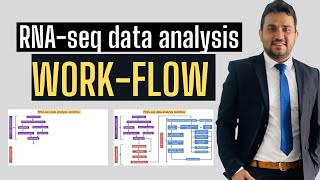
In this video, I have shown how we can interpret the results of KEGG enrichment pathway analysis in research articles? especially the Rich factor, bubble charts, p-value, and FDR.


Thank You! Truly gold value content. I am in my undergraduate in Biotechnology Engineering. I am doing a project in Bioinformatics. This was truly helpful and educational. The concepts taught are in simple language. Thank you once again!
Glad if it’s helping
very informative video sir..can you also please explain about generating these graphs in R..
It is of great worth, and important. thanks 👍👍
Glad you like it
Very informative video. Thanks
Glad you like it
Thank you so much sir, you made it really easy.
Please make a video on gwas results interpretation as well.
Glad you like it
Thanks for suggesting a great topic, definitely i will
Actually, I'm working on GWAS for salt stress in plant.
Very nice explanation
Keep watching
Allah bless you sir.
Allah bless you too
Well explained
Thanks Dr 👨⚕️
Well explained sir, please make a full video on KEGG for how to generate different type of plots
Thanks, please check the list already videos are uploaded related to this
👍
🙏
great work sir, kindly explain a little about how did you create this bubble plot
if we are using the DAVID database then how do we create the bubble
plot diagram of KEGG and GO analysis
these were genreated by R. You can use iDEP tool also for KEGG analysis.
search about the R package "clusterProfiler"
Thank you Sir. I have one question. If we want to make a heatmap, should we make it on the basis of KEGG or biological pathways of Gene Ontology?
You can choose genes from both
Thank you for detailed explaination How do set cut off to select top 3 DEG Pathway, Top 2 Highly enriched, from clusterprofiler, And also there there any standard cut to be called significant, How to mark Disease in pathview ( KEGG Plot )
How to select genes for qPCR validation in transcriptome/RNA seq data?
ruclips.net/video/PRhHBcjKAKU/видео.html
How to calculate FC, log2FC, Pvalue, Padj, Up/down genes in RNA seq data using Excel
ruclips.net/video/HH3Mll4W5WE/видео.html
@@asifmolbio thank you
Dr it very useful and understanding lecture. THANK YOU Dr
But might I know what is the apps that you use because I'm using ShinyGO but the x-axis is fold enrichment not rich factor. Might you help me because I'm little bit confius
These were generated in R
But don’t worry use of shiny go is also fine, you can explain with fold enrichment.
It is the same concept to explain using fold enrichment and rich factor?
Yes same
Dr thank you so much.
May god always blessed you
Sir one question..sir if in the excel sheet we know 23 DEGs are involved in one of the KEGG pathway then how can we identify what are those DEGs, I mean how can we trace back the DEGs. Also, are the green coloured coxes indicative of DEGs involved in that patwhay?
You can find genes which are involved in your specific pathway then can check from excel sheet it had more than 2 FC value and p value less than 0.05. If yes then that gene can be regarded as DEG.
Hello sir, I have a doubt. Can I also represent the KEGG pathway as bar chart?
Yes you can use
Sir can you put videos on circular rna analysis?
Sure i will upload soon
Last video i saw in your channel was how to upload transcriptome data. It was only Bcz of ur video, I uploaded my data. Thank you fr tht. But now I would like to know about the different pathways involved in the disease resistance (treatment) with the help of my transcriptome data. The analysis summary submitted by the company was without kegg pathways involved. So now I would like to estimate that. Plz help me in that as I hv limited time to submit of my report.
Thanks for comment, please be informed that there is no hard a fast rule to select KEGG pathway. In other words, disease resistance mechanism can be explained with the help of many possible kegg pathways. You can also choose onr of the many among suitable (with the help of literature)
@@asifmolbio Thanks for the reply. Actually I have gone through few research articles, I guess whether they have analysed kegg pathways for their disease resistance or any other specific treatment. Or they hv gone through kegg portal to identify the possible pathways involved in disease resistance. Plz check the text portion and table of one of the paper in attachment. And plz let me know what they hv actually done.
pubmed.ncbi.nlm.nih.gov/31136934/
Text section: 3.6
Table 6
So what is the best pathway should I select from the chart? and depend on which criteria? Need explanation please
Your question has answer in this video
How to select genes for qPCR validation in transcriptome/RNA seq data?
ruclips.net/video/PRhHBcjKAKU/видео.html
hello sir how do you perform KEGG enrichment analysis
iDEP tool
ruclips.net/video/6sNyNYH_v2U/видео.html
Very well explain. Truly informatics...
Can I have your mail ID?
asifalikalas@foxmail.com
very informative video sir..can you also please explain about generating these graphs in R..
Sure i will, keep watching. You can use build KEGG pathways using iDEP web based tools.