How to plot JCPDS card with the XRD data using OriginLab - 24

HTML-код
- Опубликовано: 8 фев 2025
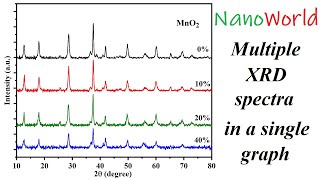
- In this video, I have shown how to plot the JCPDS (pattern) card with the XRD graph in 2 different ways.
(Note: If you need any JCPDS card, just send me an email and tell us your desired card no i.e.01-023-0456)
If you have any questions, ask them in the comment section below. For more videos, please subscribe to NanoWorld. Thank you.
#NanoWorld
______________________________________
For more updates follow us on,
Facebook: / fascinatingnanoworld
Twitter: / nanoworld8
Instagram: / nanoworld85
Contact: fascinatingnanoworld@gmail.com
______________________________________
Interpretation of SAED pattern | estimation of d-spacing & (khl) values
• Interpretation of SAED...
How to put a scale bar on SEM & TEM images (SEM/TEM data analysis)
• How to put a scale bar...
No valid atomic position available (Rietveld refinement through X’pert Highscore)
• Fixing of valid atomic...
Negative intensities in scan data points (Rietveld refinement through X’pert Highscore)
• Fixing of Negative int...
Indexing XRD peaks with Miller indices (hkl) values using X’pert Highscore software
• Indexing XRD peaks wit...
How to plot JCPDS card with the XRD data using OriginLab software
• How to plot JCPDS card...
XRD data analysis using X’pert Highscore software
• XRD data analysis usin...
Deconvolution of photoluminescence PL spectra (PL peaks fitting)
• Deconvolution of photo...
How to find peak position and FWHM of XRD data
• How to find peak posit...
How to calculate crystallites (grain) size from XRD data?
• Crystallites (grain) s...
Estimation of grain size through modifies Scherrer equation
• Grain (crystallites) s...
Crystallites size and strain using W-H plot method
• crystallites (grain) s...
Calculation of nanoparticle size through SEM image
• nanoparticles size fro...
How to find Miller indices of XRD peaks?
• How to label XRD peaks...
How to calculate d-spacing from XRD data?
• How to calculate d-spa...
How to calculate lattice constant (a, b, c) values from the XRD data?
• How to calculate latti...
How to calculate microstrain and dislocation density from XRD data?
• strain and dislocation...
How to calculate crystallinity from XRD data?
• how to calculate cryst...
How to smooth XRD data?
• How to smooth data (XR...
Baseline correction for XRD data
• Baseline correction fo...
Cyclic Voltammetry Data Analysis
• CV Data Analysis throu...
How to find bandgap energy using the Tauc plot method?
• Video
How to calculate bandgap energy using the Kubelka Munk function?
• Bandgap energy using K...
Understanding Tauc plot, 1240 (constant) and 2.303 constant
• Band gap energy (Tauc ...
How to know a material either have direct or indirect bandgap energy?
• How to know a material...
DSC Data Analysis
• DSC Analysis Through O...
TGA Data Analysis
• TGA Analysis Through O...
How to plot the double Y-axis in a single graph?
• TGA & DSC double plot ...
Electron paramagnetic resonance (EPR) data analysis (calculation of g-factor)
• Electron paramagnetic ...
_________________________________________
Music Source Unconditionally by Broken Elegance 🎩 / brokenelegance Creative Commons - Attribution 3.0 Unported - CC BY 3.0 creativecommons.... Music promoted by Audio Library • Unconditionally - Brok...


This video is extremely helpful and I prepared my first xrd graph like this way watching this video. Thanks for making and sharing it.
It helped me alot. I made my graphs with the help of this video. Learnt many features of origin.
Thank you so much for this video, I have finally been able to plot my first XRD data
Very helpful especially for me. Thanks NanoWorld. I hope that you can make videos of ploting XPS data as well. Furthermore, if you can plot EIS and Cyclic Voltammetry, then that would be very nice.
Thank you for this video, it made my work easy to plot the data.
Kudos for your work 👏
Thank you so much for uploading such kind of video, its help me lot.Thank you.
thank you very much for your help, i was trying to do this this morning xD
This video is helpful for me. Now, i need JCPDS of Graphene oxit (GO) and Cu2S. Thank you so much!
Can you plz snd me the JCPDS card of GO
@@simamkhan81 can you help me getting jcpds no. 09-0432
You are a life saver. Thanks a lot buddy
You are most welcome
Thank you so much for useful video
Thank you so much. Sir, you are doing a great job.
Thank you for sharing , it's really helpful
Your videos are very helpful. Can you please make a video for XPS, UPS as well?
You helped me!!!!! 😭
thank you sir for sharing this..
My pleasure
Dear Sir, your videos are quite nice. Can I share it on TikTok?
Thank you Sir for your support and help.......
All the best
Woww :o you're amazing Sir
I have ZnO JCPDS card No. 36-1451 and I want to know the corresponding ICSD file no.
Thank You
Sir i obtained xrd PSD data values with angle value . but graph did not plot in origin after inserting values . plz guide me .
Hi, Thank you for sharing this with us. I am using OriginPro 8.5. On my "plot details" there is no "drop line" Tab. It only includes "line", "Group" and "Offset". Is it because my Origin version is old? How can I add the JCPDS pattern without having a "drop line" option? Thanks for your help.
can you find the way or not?
i am also facing this issue?
@@fatimanovel5114 Salam Alaykom...Yes, I found it. To draw the reference pattern. You should draw it in a "scatter" or 'line+Symble" plot type, not a "line" type. This way you will have that "drop line" option.
@@mahdibeedel8390 CAN YOU SEND LINK OF ANY VIDEO?
Hi all.. right click the plot and select 'ungroup' then click the jcpds plot and give line type 'scatter' then drop lines option appear
How you shift graph to up and down or down to up side.
When I apply this is 🚫 comming
Thank you!!
whats the first file you added to the orgin lab (ZN1(XRD).asc) how to get this file
Thank you so much for uploading such a usefull videos......Can you please upload a video on BET and determination of pore diameter by BET isotherm.
Yes, soon
@@nanoworld6122 I would also appreciate this.
Hey. It’s urgent so can you please tell me how can I get ICDD number for my materials? Is JCPDS card no. A valid thing? Please help I am confused
i am working on high entropy Ceramics and i am unable analyze the XRD data via Xperthigh score due to lacking of the data cards related to my sample composition (Hf,Mo,Zr,Ti,Mo,W)B2 i only have the 2 theta and its intensity .. can you help me out from this.
IN MY COMPUTER THIS PLOT DETAIL WINDOW SIZE IS NOT REDUCING WHAT TO DO?
Hello sir... i need JCPDS card for my data. How to get this sir ?
I have synthesized ZnO nanoparticles. Whats the method to find the reference JCPDS card.
crystallography.net. In this webiste you can download the CIF file of your ZnO phase, it contains all the information about the phase. There you can find the hkl values, cell parameters, etc.
@@ilmakhan6834 if I know the chemical composition and the structure I can calculate the hkl values. So please share the reference paper and the chemical composition
Irrfan.h
This is my Gmail account
@@mohammedirfanhanif naturally occurring biopolymer 'Inulin' hkl values needed.
Thanks a lot
Sir please tell me JCPDS card no of RED MUD (waste residue from alumina industry) and BENTONITE clay
Thanks so much, please how can i enter equation pseudo first order kinetic non lineair in origin ?
Can you please provide shylkovite (monoclinic) jcpds number only.
Kindly sir.
How to find the exact basline value. Before drawing it.
the JCPDS #33-0664 is for hematite. Please send the two theta s intensity for it
is it posssible to know the miller indices by only using origin?
No,
it is very helpful, thank you for sharing this video, I need JCPDS of MoS2 data
Thanks a lot. I have a problem i cant select vertical option in origin 8 is there any solution ?
Yes, It has a solution.
What is this solution ? Plz
hhello sir. i need jcpds card number for biochar prepared from almond, pistachio and walnut shells.
Great! Thanks
Thank you.
You're welcome!
Great thankd
So, Why don't you make a video on finding JCPDS?
You can find it easily using Jade Software.
Excellent..
Great video, but this method does not work with polyphase systems. For example, I need to designate not one, but 6-8 phases, then these lines become all at the same level and it is impossible to move them up and down relative to each other. Could you make a tutorial for polyphase XRD? Thanks!
Dear Sir, for polyphase systems, it is not good look to arrange these lines in single figure. It is recommended to add different symbols on the top of each phase to distinguish different phases. Hope this can be used to solve your problems. Thanks.
Good Evening Sir could you please tell me about XRD data with JCPDS data (Card No. 361451)
please can you send me the XRD reference pattern pdf of silver sulfide (Ag2S) for monoclinic structure
The way you are copying the data of angle and intensity column of JCPDS file is not working. Please suggest me something.
It works.
Just press the "Alt" button when copying the data.
@@nanoworld6122 thanku so much sir
How to get JCPDS card ?
Hi! Please share JCPDS card no for nZCu
Sir, this video was really helpful. Thank you so much...
I need JCPDS CARD NUMBER 89-0461.
Will you help me with this..
Please, what do you mean "card no"?
When analyzing XRD data, you must have to match it with the standard data of that material. The the standard data has a reference no for each material, known as the JCPDS card. The JCPDS card no is always mentioned in the XRD section of research articles.
I need a JCPDS:08-0234 card. Is there anyone who can help me find it?
Do yuo have standard data for JCPDS file no:00-003-0863?
sir how to download jcpdf card number
Hi Sir. I need JCPDS card for NO(nitric acid). Can you please send me
I need jcpd card data for- 13-0835
Hello Sir, please help me to find JCPDS file no.of CdS as well as CdS/ZnS.
Hello,
Please send me an email. The email address is given in the description of the video.
I send an email but I did not get any respond ?
I will respond it at morning. Thank you
@@nanoworld6122 Dear sir, I sent you an email.
Could you please help me
Hi
Could you please send Zno and zirconium oxide jcpds file?
This is a very helpful video. Can you please send me the JCPDS card of 35-0754? Thank You!
Can you send me JC PDS for CaO?
provide JCPDS file for silver nanoparticles
Hello, thank you for informative video. Could you please email me jcpds card file for cellulose corn cobs? Thank you
sir, I want to draw graph of xrd of jcpds card no 48-0083..kindly help me sir
How I'm supposed to send you this card?
Please email me at,
fascinatingnanoworld@gmail.com
@@nanoworld6122 hello
@@nanoworld6122 sir I need Xpert software how can I download it
nice video. I just sent you an e-mail about it.
Please share JCPDS card 43-1003 file
Could you send me silver oxide jcpds card file
Dear Sir, Thank you very much for your video, This video is extremely helpful. Now, i need JCPDS of La2MnTiO6, Could you please email me jcpds card file for La2MnTiO6, Thank you!
hello... great video! can u provide me JCPDS data for V2O5?? i guess it is 41-1426.
Hello, thank you for informative video. Could you please email me jcpds card file for Magnesium, Magnesium phosphate, and hydroxiapatite? Thank you
Please send me JCPDS of 01-1174. Thank you in advance
This is very informative video thank u for this could you please email me a Jcpds cards file for zinc oxide nanoparticles Ag20 and Ag20-zno nanocomposite. Thank u
Hello, thank you for informative video. Could you please email me jcpds card file for reduced graphene oxide, Bismuth oxide and zirconium oxide. Thank you
Peak of GO show in xrd graph...???
Can you please provide me JCPDS CARD 26-0575? Thanks.
Hi, firstly, thank you for sharing this useful video with us. I need JCPDS card No. 54-2162 (magnesium benzene-1,4-dicarboxylate dihydrate-C8 H8 Mg O6).
I just sent you an e-mail about it .
Hello sir
I have sent you an email, my you willing to check it sir? thanks in advance
Thanks for such a nice video. please keep uploading such worthful videos. i am in need of ICSD # 157654. please send me this card.
hello sir ,i have emailed you .please check it.thank you very much
I sent you on the e.mail
I responded.
Sir, I sent an email
Please help me
I send you an email Sir. Please help me :(
I responded, Please check your email.
Thank you for this amazing video... I need JCPDS no. 09-04-32...
I will send an email to you
Thanks alot
@NanoWorld Dear sir, I sent you a email.
Could you please help me
i need jcpds card no. 19-0193
Thanks a lot