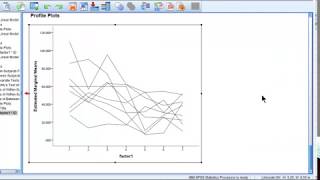
Modern repeated measures analysis (3) Profile/spaghetti plotting in SPSS and r (lattice package)

HTML-код
- Опубликовано: 4 окт 2024
- One of the most useful and important things to do first when analysing a repeated measures dataset is to produce a graph of the outcome variable you are interested in against time, and it us usual to produce a line for each unit, such as patient etc.
Robin Beaumont
for Full notes, MCQ's etc see:
www.robin-beaumont.co.uk/virtualclassroom/stats/course2.html


![Tee Grizzley - Robbery 8 [Official Video]](http://i.ytimg.com/vi/34_vkNV6wrU/mqdefault.jpg)
