Cloud Compare 1: Point Cloud visualisation

HTML-код
- Опубликовано: 10 сен 2024
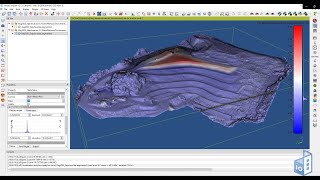
- This video shows how to open a .LAS file and how to visualise and colour point clouds based on different attributes (i.e. Point classification, intensity, etc), how to export a scalar field as RGB, and how to export 'z' coordinates as a scalar field representing the height of each point. These can be coloured accordingly and displayed as a Toogle Scale bar.
This video was created as part of the Remote Learning Pathway activities for students of LARCH7031 - Extreme Territories Studio - School of Architecture and Built Environment. Univeristy of Adelaide: More info: bartesaghikoc....
Acknowledgements: The data used in this video was derived from LiDAR point clouds kindly provided by Aerometrex for teaching purposes.


Can you please send the points file that you are working on in the video?
why does everyone press yes to lower points in las file to import into cloudcompare? what if i want all of the points? isnt it taking away from the quality of my scan?
I eliminate points when I bring a cloud into CAD. I don't need all the points (esp across the surface of planes) and it just makes things heavier. All I really care about are edges so I can trace them into vector line work.
friend and how I classify the points I thank you for the answer?
Usually using Globe mapper but there are many other ways
@@CarlosBartesaghiKoc which other ways? can you please point them out?