Stacked and Clustered Column Chart in Project Management
US
Войти
Introduction to Pivot Tables, Charts, and Dashboards (Part 2)
14:48
Gauge Chart in Power BI for monitoring a sample project Part 2
6:32
Tableau Training for Beginners in Telugu | Tableau Tutorial for Beginners in Telugu | Edureka Telugu
1:00:15
LOVE, HURTS | Jordan Brand
00:31
Smurfs | Official Trailer (2025 Movie) - Rihanna
02:36
Guard The NFL Player Win $40,000! (1on1’s in Tallahassee)
23:04
Stacked and Clustered Column Chart in Project Management
Project Management Solutions
Подписаться
251
Скачать
Готовим ссылку...
Просмотров 23
23
0
Добавить в
Мой плейлист
Посмотреть позже
Поделиться
Поделиться
HTML-код
Размер видео:
1280 X 720
853 X 480
640 X 360
Показать панель управления
Автовоспроизведение
Автоповтор
Опубликовано: 10 фев 2025
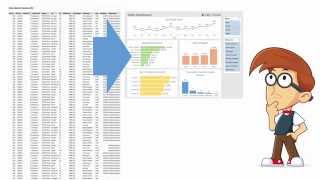
In this video, you will have to learn how to create a stacked and clustered column chart in Excel for a building project.
Комментарии •
Следующие
Автовоспроизведение
14:48
Introduction to Pivot Tables, Charts, and Dashboards (Part 2)
Excel Campus - Jon
Просмотров 3,1 млн
6:32
Gauge Chart in Power BI for monitoring a sample project Part 2
Project Management Solutions
Просмотров 79
1:00:15
Tableau Training for Beginners in Telugu | Tableau Tutorial for Beginners in Telugu | Edureka Telugu
edureka! Telugu
Просмотров 121 тыс.
00:31
LOVE, HURTS | Jordan Brand
Jordan
Просмотров 10 млн
02:36
Smurfs | Official Trailer (2025 Movie) - Rihanna
Paramount Pictures
Просмотров 5 млн
23:04
Guard The NFL Player Win $40,000! (1on1’s in Tallahassee)
Deestroying
Просмотров 762 тыс.
01:19
Breaking News: 𝐍𝐞𝐰 𝐇𝐨𝐫𝐢𝐳𝐨𝐧𝐬 Await on Family Island! 🦫🦫🦫
Family Island Game
Просмотров 341 тыс.
15:59
How to Make the BEST Gantt Chart in Excel (looks like Microsoft Project!)
David McLachlan
Просмотров 1,6 млн
23:51
Video 4: Data Visualization in Excel: Histogram, Box, Bar and stacked plot, Scatter plot, Line graph
Shakeel Ahmed
Просмотров 60
14:25
Land sale,Water and Electric Demand in Excel for an Industrial Estate
Project Management Solutions
Просмотров 49
15:19
How to Create a Dashboard Using Pivot Tables and Charts in Excel (Part 3)
Excel Campus - Jon
Просмотров 2,5 млн
1:57:23
Excel VBA Advanced Tutorial
Learnit Training
Просмотров 1,1 млн
8:05
Excel Macro usage in Project Management
Project Management Solutions
Просмотров 36
28:30
☑️ Top 25 Advanced Pivot Table Tips & Tricks For Microsoft Excel
How To Excel
Просмотров 801 тыс.
38:06
Getting Started With Power BI - Visuals
Talha Parkar
Просмотров 107
14:48
Introduction to Pivot Tables, Charts, and Dashboards in Excel (Part 1)
Excel Campus - Jon
Просмотров 14 млн
5:10:23
LIVE: Team Vitality vs. Team Spirit - IEM Katowice 2025 - Grand Final
ESL Counter-Strike
Просмотров 1,4 млн
00:54
дети раньше vs дети сейчас (телефон)
БЕРТ
Просмотров 263 тыс.
58:58
Самодельный спорткар уже дымит колесами и наезжает на создателя
Игорь Негода
Просмотров 150 тыс.
44:30
ОКАЗИЯ. НАШЛИ СПУСТЯ 7 ЛЕТ. СУДЬБА ПРОЕКТА.
AcademeG
Просмотров 860 тыс.
18:26
"Я забрала твой дом по наследству, теперь это будет моя дача" - невестка обомлела от слов свекрови.
УВЛЕКАТЕЛЬНОЕ ЧТИВО
Просмотров 99 тыс.
11:54:58
БИТВА БЛОГЕРОВ - В 20:30 СТАРТ РИСКОВАННОЙ АТАКИ! [БЫТЬ ВСЕМ]
Near_You
Просмотров 126 тыс.
00:53
Onesie Baby Shower Cake #Shorts
Chefclub Shorts
Просмотров 2,2 млн
00:13
Каждый русский уже знает итальянский язык 😳 @nastyawhere
Super Italiano
Просмотров 635 тыс.