Easy Summary Tables in R with gtsummary

Поделиться
HTML-код
  • Опубликовано: 11 сен 2024
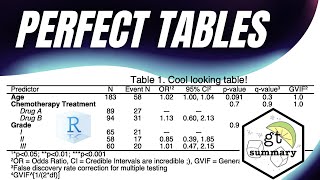
  • The gtsummary package lets you produce summary statistics for your numeric and categorical variables, formatted into a neat table. You can include p-values for pairwise comparisons and also split your summary across the categories of one of your covariates.
    Code available from drlyndonwalker...
    My SkillShare courses: (includes a 1 month free trial)
    Getting started with R skl.sh/3cyKwzi
    How to Write an Academic Journal Article skl.sh/3hpm3i0
    How to read an academic paper skl.sh/3wO9Skp
    Introduction to Flipped Classroom Teaching skl.sh/3TBK7jw
    Connect with me:
    🐥 My Twitter - / drlyndonwalker
    💻 My Website - www.drlyndonwa...
    Join my Facebook Community - / drlyndonwalker

Комментарии • 29

  • @SimonMcGrath
    @SimonMcGrath 3 месяца назад +1

    Thanks very much. This is a great little package, well explained, and it’s made my life a lot easier.

  • @raould2590
    @raould2590 Год назад +2

    This is excellent, very helpful! Thank you so much for this!

  • @AM-rp8xn
    @AM-rp8xn Год назад +1

    In the middle of finishing a research thesis and was struggling with the table 1 function. Thanks for explaining the functionality of this package in such an easy to understand way!

  • @luwanda03
    @luwanda03 4 месяца назад +1

    Thanks, Walker! I am now your new subscriber

  • @mdhayirmohamud595
    @mdhayirmohamud595 8 месяцев назад +1

    Very helpful. Thank you

  • @hseyedagha
    @hseyedagha Год назад +1

    that was helpful, thanks for sharing 😊😊

  • @lavedadean
    @lavedadean Год назад +1

    Well explained here thanks

  • @andresvinueza1992
    @andresvinueza1992 9 месяцев назад +1

    Muchisimas gracias. Saludos desde Cuba. :)

    • @luwanda03
      @luwanda03 4 месяца назад

      Oiga hermano, de que parte de Cuba estas hermano?

  • @danielkusters1564
    @danielkusters1564 6 месяцев назад +1

    tks so much!!!!

  • @nukenelson
    @nukenelson 3 месяца назад

    Is it possible that alongwith P value we also have Chi Square Statistics value & df value in GtSummary table..if yes what's the code

    • @DrLyndonWalker
      @DrLyndonWalker  3 месяца назад +1

      Absolutely. It's in the list here: www.danieldsjoberg.com/gtsummary/reference/tests.html

    • @nukenelson
      @nukenelson 3 месяца назад

      @@DrLyndonWalker As I was going through the reference you forwarded: ( correct me if I am wrong )
      1. add_p() function will automatically pick up the relevant available Statistical test and will provide the values
      2. In add_p(test.args=) function , I need to specify the relevant test using code given adajcent to the test, it will not automatically pick up the available statistical test.

    • @DrLyndonWalker
      @DrLyndonWalker  3 месяца назад

      ​@nukenelson not in front of R right to test but something like this should do it.
      chatgpt.com/share/0fca98cf-7d8d-4795-a737-7475bbe7d79a

  • @MizanurShuvraRidwan
    @MizanurShuvraRidwan 5 месяцев назад

    Thanks for the video, do you know how to create summary tables for Multiple response questions? Would highly appreciate any guidance.

    • @DrLyndonWalker
      @DrLyndonWalker  5 месяцев назад

      Maybe something like this cran.r-project.org/web/packages/tidyREDCap/vignettes/makeChooseAllTable.html

    • @MizanurShuvraRidwan
      @MizanurShuvraRidwan 5 месяцев назад

      @@DrLyndonWalker Thank you sir! Really apprecaite it!

  • @diegorada2235
    @diegorada2235 Год назад

    Thank you for the excellent video. Is there any way to add the missing value propositions by variable?

    • @DrLyndonWalker
      @DrLyndonWalker  Год назад

      There is the missing parameter in tbl_summary but it is global (omit all, always include, only show if present). If you wanted to include/exclude a single variable only I would do it earlier in the chain by using something like na.omit or subsetting (eg something like square brackets with an !is.na()

  • @jukangRN
    @jukangRN 11 месяцев назад

    Thank you for the video. I get an error message below when I try to require (installation works without any issues) gtsummary. Do you know what I should do to solve this issue?
    I would appreciate any guidance. Thanks.
    "Error: package or namespace load failed for ‘gtsummary’ in loadNamespace(i, c(lib.loc, .libPaths()), versionCheck = vI[[i]]):
    namespace ‘vctrs’ 0.6.2 is already loaded, but >= 0.6.3 is required"

    • @DrLyndonWalker
      @DrLyndonWalker  11 месяцев назад

      Try install.packages("vctrs"). If that doesn't work, run remove.packages("vctrs") first and then try install.packages("vctrs") run remove.packages("vctrs") first and then try install.packages("vctrs")

    • @jukangRN
      @jukangRN 8 месяцев назад

      @@DrLyndonWalker Thank you!!

  • @user-dl8le5cs6t
    @user-dl8le5cs6t 5 месяцев назад

    is there a way I can include complex survey design to get weighted estimates?

    • @DrLyndonWalker
      @DrLyndonWalker  5 месяцев назад

      I would do that by using a package like survey to get the figures I want, then a table package like flextable or tabyl in janitor to make my tables.

  • @matiasramirez8443
    @matiasramirez8443 Год назад

    should this package work well when knitting into PDF or word?

    • @DrLyndonWalker
      @DrLyndonWalker  Год назад

      There is a great summary on this blog: www.danieldsjoberg.com/gtsummary/articles/rmarkdown.html

  • @kondaranjithgoud3097
    @kondaranjithgoud3097 9 месяцев назад

    Hello Sir,
    Could you please guide me how to convert the viewer window to RTF file in R

    • @DrLyndonWalker
      @DrLyndonWalker  9 месяцев назад

      Do you want to export as an rtf? You could use rmarkdown for the whole project bookdown.org/yihui/rmarkdown/rich-text-format-document.html
      Or something like this for just the image
      stackoverflow.com/questions/38035764/r-language-writing-a-jpeg-into-an-rtf-document-using-rtf-package