FACS Data Interpretation Explained

HTML-код
- Опубликовано: 9 сен 2024
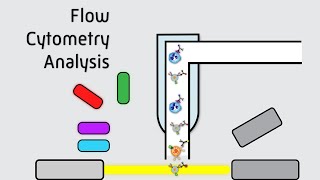
- Flow cytometry uses light scattering caused by cells in a sample which are passed through a laser beam. This light scatters in the forward direction as well as the side direction and is called forward scatter, and side scatter respectively. Forward scatter is proportional to the size of the cell, while side scatter is proportional to the complexity of the cell. Both the forward and side scatter gets detected and converted into an electric pulse, which is directly proportional to the amount of scattered light.
In FACS, which stands for fluorescence-activated cell sorting, naturally occurring fluorophores or fluorophore-labeled antigens which attach to select cells absorb and reemit light which gets detected by a multitude of detectors in the following manner. Depending on which combination of detectors pickup the light we know what fluorophore has been excited. This gives us even more data which can be represented in several ways.
All flow cytometry data is usually represented in one of two ways: histograms, which measure or compare only a single parameter, and dot-plots which compare 2 or 3 parameters simultaneously on two- or three-dimensional scatter-plots. In addition, the data can also be displayed in a pseudo color plot as well as contour plot.
A histogram typically plots the intensity on the y-axis and the number of events detected at that intensity on the x-axis. A large number of events detected at one particular intensity will be displayed as a spike on the histogram.
By contrast, in a dot plot, each event is represented as a single point on a scatter-plot. Intensity of 2 different channels (or 3 different channels in a three-dimensional plot) are represented along the various axes. Events with similar intensities will cluster together in the same region on the scatter-plot.
A pseudo color plot is similar to the dot plot but with the added benefit of seeing the density of the cells relative to one another. Blue and green correspond to areas of lower cell density. Yellow corresponds to mid-range cell density and orange and red are areas of higher cell density.
In a contour plot, only a small number of events is collected. Contour plots display the relative frequency of the populations, regardless of the number of events collected. Differences between two sets of data may be easier to visualize and distinguish from one another by drawing contour lines, when the total data available is limited. However, when many events have been collected, contour plots are not as useful.
To further improve the resolution of a flow cytometry graph, we can use a process called gating.


very helpful! thanks a lot!
That's lovely to hear, thanks a lot!
Hi Lucas, I have a question: How can I present flow data using cell count (besides frequency)? When I have minor events (in cases where I have to use a contour plot), the frequency sometimes doesn't translate the data. Thank you!!!!
Great question! I'm sad to admit that I do not know the answer. I'll see if I can find anything helpful and send it your way if I do😇👍
Where can i find the gating video?
I ended up not doing it, my apologies!
But I'll get it done in January and link it after this video as soon as it's done!🙏
Too bad it ends here :(
Are you referring to the FACS Gating video? Or what do you mean?🙈