So in flow cytometry, do you tag the cells with fluorescent antibodies (or whatever additional selective procedures) first before running it through? Or is it common to run it more than once in a lab with different treatments on the population? Thanks for the video!
Great question Philmon! Yes you tag the cells before running it through :) So you start with a tube containing cells in liquid (say 500,000 cells in 0.5ml). You stain them by adding antibodies, dyes to the liquid. Then you wash out the excess dye by centrifuging (cells drop to bottom) and remove the liquid. Resuspend the cells in new liquid and you're ready to take the tube to the machine for analysis. It's only possible to run sample though the flow cytometer once. There is a liquid waste container to collect everything. But you leave the machine with your data. If you want to collect your cells, or a subset of your cells, you can run it through a FACS machine. This can dispense the cells again (e.g. all red cells into one tube, all green cells into a second tube). You can use multiple stains at the same time on one sample. The dyes selected must be separated from each other on the colour spectrum (and your machine needs multiple different colour lasers & filters). Then you can do something called 'compensation' to subtract any colour overlap. You also need controls (a tube of single-colour-stained cells for each fluorophore you choose). Hope this help!
"Understanding flow figures from real publications" was the best section. Of course only because it kind of put in practice what you clearly explained before. Thank you!
So here's the TLDR on flow cytometry and FACS! What is flow cytometry? - 0:38 Flow cytometry Vs FACS? - 1:45 What happens with flow data? - 2:06 Summary of data analysis - 5:22 Understanding figures - 5:46 Summary diagrams - 8:22
The master stroke on this video are the simplified graphs on the side of the lab data that explain what really happening to the cell... fantastic!!! great video!!!
This is fantastic! I'm an immunology master student and this has really helped me out (having not experienced much flow before). It'd be fantastic to see you make a series on different techniques (such as western blot or qPCR), particularly on the data interpretation as you explain it so well.
Thanks Will! I do have more data interpretation videos on my to-do list, and Western blot is right up at the top! I never had any classes on how to interpret blots/facs plots etc, it was pretty much assumed knowledge 😅 so I'm happy to hear the video was useful for you!
this is one of the most diverse channels I've visited with original content. I came and left learning about flow cytometry, went to look for more and realised there were cat videos, pancakes and how to sew curtains. Im going to look at western blot next. I'm starting a lab research role and have been scouring youtube to not look like an idiot on the first day,week, month. Thank you for the content !
Thank you for such a kind comment! Good luck joining a lab 😊 my first day in the lab... EVERYTHING was like another language. I had a notebook to write down all the jargon... PBS, DMEM, TC, HELA, doing a "transfer", "fixing" cells. I hadn't heard of any of them 😅 I'm sure you'll do great at your job being so proactive before even starting!
Wonderful video. I work in chemistry and metabolomics so I had little experience working through flow cytometry data. Still, I had to review some immunology work for my thesis (people so familiar with this work that they didn't bother to label either axis) - so this was a good review of the basis. Thanks for making this video.
This video was quite useful to me! I play Eve Online and they have a "citizen science" mini-game module where the player base can help crowdsource some basic science data analysis in the real world. The current project is identifying clusters in flow cytometry data (for building a learning set for machine learning AI). I was curious what those scatterplot graphs meant, and this video was exactly what I was looking for. Thanks! (I know, this is probably the most random gaming/science crossover comment you'll get)
Hello Emma, thank you for the fantastic video. I am struggling with the concept of doublet discrimination. Can you elaborate ? What’s the difference between single cells and doublet (which are present at the top). Thank you for the help.
thank you so much for explaining! i have been struggling with this paper with facs data in it that just made no sense to me. also when people talk about doing a facs sorting in lab meetings n you dont understand what that is but u dont want to ask too basic questions... anyway all im saying is ur video has really helped me and the diagrams are really nice and i like how you talk us through real data. so i cannot thank you enough! please make more videos like this on other techniques too! subscribed!!
Great video! Quick question: how did you know that the top half of the cells took up the DAPI dye but the bottom half did not when interpreting the DAPI vs. FSC-A plot. Do you base it off certain concentration of DAPI?
My question is, how do you know what point on the chart your cells are located? Is there a known size that these cells have that gives you certainty of where they sit on the chart?
Can you please share a more elaborated video on gating strategies. And also the data analysis part. Or else if possible, can you suggest some literature that can help me with the same?
Okay so if you do a flow cytometry on leukocyt cells, which have flourescent markers on them, how do you then calculate the number of different leukocyt cells?
Hi Emma, just a little confused are the green and red splotches on the graphs the fluorescent given off by the antibodies? I’m finding interpreting the graphs confusing. Great vid thanks
Quick question about flow, how much area on the cell would be blocked by the filter so the detector only detects the periphery of the cells? Thank you very much
outstanding explanation, I'm immunology PhD student, currently i'm using BD Accuri C6 Plus cytometer to analyse PBMC from cattle breed. Unfortenally, i don't have high background on cytometry data analysis and interpretation. Please, i need a help.
Rest in Peace....He passed away today. My brother...B/D first FACS machine, Innovated the industry. He invented this process ...also was XY INC. Colorado final stage VP operations R/D ST Genetics. @t Give praise he gave us what we have today. Thanks to all in the industry...God Speed.
This is a great question. Most gating is drawn by hand, so lots of inherent variation. There are often control samples that we can use to set gating thresholds (I.e. an unstained sample compared to an EpCAM-PE stained sample), but again, the exact point is selected by individuals. BUT gates will be copied to all samples, so whatever exact gate is selected will be consistent throughout all the data.
Hi, thanks for your video. Can flow cytometry be used for blood typing? I'm a veterinary student and I want to know how I can type dogs blood by flow cytometry. If you have any information I'd appreciate it if you help.
So I don't understand one thing with gating. You take an area of cells you want and test them for another parameter. How exactly do you do that? If I understand right, you can do that only by prior sorting, right? But these areas defined in the graph look like you made them after the cytometry is done, because otherwise, you can tell a computer only ''choose cells that are bigger than X and more granular than Y" and get a square area in the graph, which os not the case. So how does it work?
Yes that's right! I "gate" after the cytometry data is all collected. Just sitting at the computer with my data. My cells are long dead, in the waste tank. But I have all the measurements for each cell that flowed through the machine. Think of gating as selecting only a certain group of cells. Imagine the data is an excel spread sheet. I select only cells with a set value FSC, and I highlight them, then copy and paste to the next tab for further analysis. If I want to do cell sorting, it's a different machine. I draw gates on the cells live at the machine, to tell it which ones to spit out again. Hope this helps!
@@EmmaSandy Oh wow, cool, thanks for the answer! Meanwhile I have been introduced to FlowJo for the first time to gate two years old data haha, so that makes sense now. So when a single cell flows through the machine, it tests the cell for ALL the parameters and antibodies you pick at the same time? We want to find Tregs population for example, but from the same data, we can also find T17? Thank you for the video!
Hey Emma, I am new to Flow Cytometry and I am also looking at cells in the Lung. I am wondering how do you know where to cut off your debris from your cells of interest in your first plot?
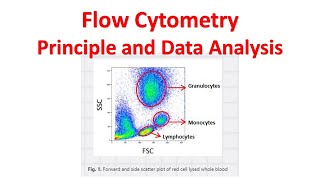
Hi Maria, the lungs are some of the "dirtiest" samples to look at by flow cytometry. I usually set to pseudo colour plots for gating this. I can see the 'hotspot' indicated by pseudocolour plots and I select these as my cells. Anything much lower on the SSC & FSC axis are likely debris in my samples.
Dear Sandy, I love watching your video. I am new PhD student who is exploring about flow cytometry. I am using FACs for blood cells analysis and need guidance. I do not have proper guidance right now and wandering if you can spare your time to look at my data for discussion. I don't know how to contact you directly. So, I wrote here and hope you see my message.
Hey Emma, thank you for this video, really helpful!! I am still confused about how to gate for specific cell populations? Do each population have its particular gating line? I am a new graduate student and always have questions haha
That is a great question! I will try to explain. Each cell type that you want to study on the flow cytometry should be identified by 'marker proteins'. These are usually surface membrane proteins that are unique to that cell type. Scientists have studies these proteins and know each are found on a certain cell type. For example, epithelial cells express 'EpCAM' (epithelial cell adhesion molecule) on their surface. Endothelial cells express 'CD31' protein on their membrane. (note the 'CD' is just a numbering system for proteins of the immune system, it stands for class of differentiation). Macrophages can be identified by 'CD11b' protein on their surface. If our cell is positive for CD31, we can call it an endothelial cell. Search for 'cell markers' and try a cell type to see more examples. Each cell (or dust particle) that passes through the flow cytometer, only goes through once. We have to collect all of the information at once, as it flows past the lasers. Combining the different lasers at one time, we must collect info on the particle's size, it's granularity, is it expressing CD31, is there DNA present. Then we can dissect all this data to identify only the cells we are interested in by drawing gating lines. Where to draw gating lines- if we are looking for CD31+ stained cells, we should go to the cytometer with 2 tubes of cells. One with our cells, stained with CD31 antibody, and one which is unstained. We collect data on 10,000 cell from each tube. Then we compare these graphs beside eachother (with CD31 on the axis), we can see where the positive gate should be drawn. Unstained controls are needed in every experiment to know where the gate is drawn. I hope this helps!
Thanks Sramona, I'm working on a western blotting video next. Then I think PCRs could be a good topic for the future. If you'd like any specific topics let me know :)
thanks Emma! may i ask what does gating actually mean? are the cells re-passed through the flow cytometer after sorting? or is it just re-plotting the data in the graphs?
To gate cells they do not pass through the cytometer again, the graph is just replotted. Imagine an excel spread sheet with 1 row being 1 cell, you just highlight the ones you're interest them, copy and paste them into a new tab. A new tab = a new gate.
Thank you for this. I’m doing some gating for algorithm training in the virtual world of Eve online’s Project Discovery of dot histograms. Because I have no axis to base my gates what are some best practices in general gating ways of being both specific and general?
Great question! If you have 'unstained' and 'stained' samples, then I would set the gate at the maximum& beyond the peak of the unstained. That way, any signal you are seeing is not background & you select the true 'positive' cells.
Hi Emma! Thank you for your video! Im new in FC too and Im working with finding carcinoma cells in serous fluids. I can find them, when I use the proper markers, but I still have doubts as to when I can classify the events in FSC and SSC as heterogenous or homogenous (they are certainly very complex and big, that part i got right, but i also know that carcinoma can sometimes vary in size and complexity). do you know of any bibliography that can explain that?
Hi Vlad, I'm glad the video was useful! I'm not familiar with that field, but one way to search literature is to use google scholar. Try searching for your key words "carcinoma cells in serous fluid facs" in google scholar, then narrow down the publication date (maybe last 10 years) and try (research article only). Also I've been tripped up a few times by using niche key words, so make sure to broaden your search to words others may use, for example you may only ever say "serous fluids" but others could say "serosal fluid; peritoneal fluid" for example. Hope this helps.
I'm guessing the PE channel was used to detect the DNA stain propidium iodide? If you set the Y axis to 'histogram', and the X-axis to PE-A, you should see peaks. The first peak will be haploid (smallest DNA, least PI), the next peak should be diploid (double DNA, more PI), and the next peak and so on. That's my best guess, but I'm not familiar with your data. Good luck!
MFI = mean fluorescence intensity. So in a histogram your x axis (horizontal axis) usually says fluorescence (i.e. GFP). I'll guess it is X-mean. Take a look at your scale and see if the number makes sense.
Hi! There is a really old MMORPG game called EVE Online, where players can participate in a project, where the play a "mini game" inside the game, where they actually analize flow cytometry data. The aim is to help covid research. The large player base, and the user interface the game designers created, resulted in more than 40million samples analized so far. The problem is, that since the players do not have a specific science degree. The results could be better, if someone, using the in-game UI made a youtube vid, describing HOW to do BETTER in analyzing stuff. Unfortunatelly i did not find any such video. Maybe you could do that? It would help the researchers partnered with the game developers get better data, you could get some views on your channel, and (what i think is most important) spread scientific awareness.


So in flow cytometry, do you tag the cells with fluorescent antibodies (or whatever additional selective procedures) first before running it through? Or is it common to run it more than once in a lab with different treatments on the population?
Thanks for the video!
Great question Philmon! Yes you tag the cells before running it through :)
So you start with a tube containing cells in liquid (say 500,000 cells in 0.5ml). You stain them by adding antibodies, dyes to the liquid. Then you wash out the excess dye by centrifuging (cells drop to bottom) and remove the liquid. Resuspend the cells in new liquid and you're ready to take the tube to the machine for analysis.
It's only possible to run sample though the flow cytometer once. There is a liquid waste container to collect everything. But you leave the machine with your data.
If you want to collect your cells, or a subset of your cells, you can run it through a FACS machine. This can dispense the cells again (e.g. all red cells into one tube, all green cells into a second tube).
You can use multiple stains at the same time on one sample. The dyes selected must be separated from each other on the colour spectrum (and your machine needs multiple different colour lasers & filters). Then you can do something called 'compensation' to subtract any colour overlap. You also need controls (a tube of single-colour-stained cells for each fluorophore you choose).
Hope this help!
@@EmmaSandy Helps a lot, thank you for the additional information!
@@EmmaSandy Please, do you have any recorded video on compensation? I'm a newbie to Flow Cytometry.
"Understanding flow figures from real publications" was the best section. Of course only because it kind of put in practice what you clearly explained before. Thank you!
As an undergrad who is struggling to understand all the immunology papers, you helped me a lot, thank you!
Im in the same exact boat, your video really helped me understand what exactly I was reading and looking at🤧 thank you so much😭😭❤️
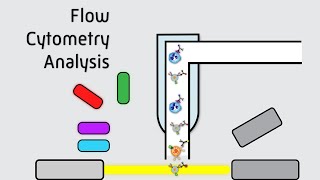
So here's the TLDR on flow cytometry and FACS!
What is flow cytometry? - 0:38
Flow cytometry Vs FACS? - 1:45
What happens with flow data? - 2:06
Summary of data analysis - 5:22
Understanding figures - 5:46
Summary diagrams - 8:22
Thank you so much Emma for providing a concise introduction of flow cytometry. Most videos make everything so confusing and difficult.
One of the best biology explanations on RUclips, thanks! Incredibly helpful
The master stroke on this video are the simplified graphs on the side of the lab data that explain what really happening to the cell... fantastic!!! great video!!!
I'm so happy!! I finally understand what all these images actually show. I can't thank you enough.
My English is not that good. But you speak so clear that i could understand everything. Thanks for the great video. :)
This is fantastic! I'm an immunology master student and this has really helped me out (having not experienced much flow before). It'd be fantastic to see you make a series on different techniques (such as western blot or qPCR), particularly on the data interpretation as you explain it so well.
Thanks Will! I do have more data interpretation videos on my to-do list, and Western blot is right up at the top! I never had any classes on how to interpret blots/facs plots etc, it was pretty much assumed knowledge 😅 so I'm happy to hear the video was useful for you!
Thank you so much. This is the kind of explanation I was looking for years!
this is one of the most diverse channels I've visited with original content. I came and left learning about flow cytometry, went to look for more and realised there were cat videos, pancakes and how to sew curtains. Im going to look at western blot next. I'm starting a lab research role and have been scouring youtube to not look like an idiot on the first day,week, month.
Thank you for the content !
Thank you for such a kind comment! Good luck joining a lab 😊 my first day in the lab... EVERYTHING was like another language. I had a notebook to write down all the jargon... PBS, DMEM, TC, HELA, doing a "transfer", "fixing" cells. I hadn't heard of any of them 😅 I'm sure you'll do great at your job being so proactive before even starting!
This is a great help for me as a medical technologist running CD4 enumeration using Beckman-Coulter Aquios CL flowcytometer.
I am so glad to have found your channel. Thank you for making science easy for newbies like me.
As a brand new grad student, this was super helpful! Thank you so much!!
Thanks Faris! I'm happy to hear it was useful for you! 😄
This was a wonderful description with excellent graphs and clear explanation! Thank you!
Super interesting ! Big thank you from Morocco
I just cant be more thankful
😊
This was so helpful and concise. It's perfect for a quick revision! Thank you!
INCREDIBLY helpful! Thank you so much! To the point, and with real world examples is perfect!
Super clear! Thanks so much for taking the time to make this!
As someone just starting their PhD, this is so useful! Thank you so much!
This was an amazingly helpful video!
Thanks Andrew! So glad it was helpful!
I am trying to build a Cytometry panel as a class project and your video is really useful! Thank you so much :)
Good luck with your project Diego! I'm happy to hear the video was useful for you 😄
Thank you so much for the video! I had problems in interpreting the graphs derived from FACS technique, but with this video everything is clear!
You’re a savior! Thank you so much
Thanks!!! Very interesting. It helped a lot to understand my Principal Investigator's reports.
Great explanation, thanks!
Thank you so much for your detailed video. It was extremely helpful!
Thanks Emma - well explained.
Glad it was helpful!
Thanks your video is awesome! Very well explained, in not much time, and helped me a lot!
amazing video....rocking...
Thanks for this video; watched it while in traffic to work this morning (starting work in a wet lab that uses FACS).
Best of luck in the lab!
Well done, superbly explained
Wow. this is incredibly useful for me. thanks!
Your science videos are AMAZING!
Please consider making some on immuno-florescence, ELISA, immuno-precipitation...etc
Wonderful video. I work in chemistry and metabolomics so I had little experience working through flow cytometry data. Still, I had to review some immunology work for my thesis (people so familiar with this work that they didn't bother to label either axis) - so this was a good review of the basis. Thanks for making this video.
My pleasure! Glad it was useful! The lazy axis labelling is too common in flow cytometry data. Not useful for anyone! Good luck with the reviewing.
very nice! thanks a lot for such a clear explanation of FACS!
thank you for this video. I am new at flowcytometry this video cleared up some confusions i had.
I'm happy to hear it was useful Hans 😄
Excellent video! Thank you so much for the great lesson!
Amazingly explained!
loved your tutorial
thank you that was so simple and to the point
thank you !!! such a helpful video!! Especially seeing your data and the published data as examples. :)
So helpful thank you!
This video was quite useful to me! I play Eve Online and they have a "citizen science" mini-game module where the player base can help crowdsource some basic science data analysis in the real world. The current project is identifying clusters in flow cytometry data (for building a learning set for machine learning AI). I was curious what those scatterplot graphs meant, and this video was exactly what I was looking for. Thanks! (I know, this is probably the most random gaming/science crossover comment you'll get)
I appreciate the captions!
Hello Emma, thank you for the fantastic video. I am struggling with the concept of doublet discrimination. Can you elaborate ? What’s the difference between single cells and doublet (which are present at the top). Thank you for the help.
thank you so much for explaining! i have been struggling with this paper with facs data in it that just made no sense to me. also when people talk about doing a facs sorting in lab meetings n you dont understand what that is but u dont want to ask too basic questions... anyway all im saying is ur video has really helped me and the diagrams are really nice and i like how you talk us through real data. so i cannot thank you enough! please make more videos like this on other techniques too! subscribed!!
Great video!
Quick question: how did you know that the top half of the cells took up the DAPI dye but the bottom half did not when interpreting the DAPI vs. FSC-A plot.
Do you base it off certain concentration of DAPI?
Thank you so much!
Thanks a lot! Informative and helped me alot
Brilliant. Helped a lot
My question is, how do you know what point on the chart your cells are located? Is there a known size that these cells have that gives you certainty of where they sit on the chart?
thanks for your contribution
Great explanation! I was wondering what the numbers on the plots at 3:57 mean. Such as the 93.6 or 84.6?
Hello. Those numbers are percentages. So inside the gate has circled 93.6% of the cells displayed on the plot.
@@EmmaSandy Thanks so much!
Wow thank youbfor this video that was super helpful 😁😊
Thank you, this was super helpful!!
Can you please share a more elaborated video on gating strategies. And also the data analysis part. Or else if possible, can you suggest some literature that can help me with the same?
thank you so much for this video!! so helpful! :~))
Glad it was useful Jenn 💙
This was a great video! Thanks!!
Thank you so much ❤️❤️❤️🇮🇹
Thank you, much useful. Record more data interpretation videos, please!
Thank you had a presentation but imma undergrad so like, I can interpret the data I just literally didn’t know what the data was 😭😭😭😭 you saved me
Glad it was useful, I'm sure you're presentation was fantastic 🤘
This was brilliant! Thank you!
Hi! Thanks for the info! Very good.
Which software do you find to be the best to analysis flow data?
I prefer FlowJo and found it quite intuitive. It is expensive, but have had shared licenses before that worked well!
amazing
Thank you
Okay so if you do a flow cytometry on leukocyt cells, which have flourescent markers on them, how do you then calculate the number of different leukocyt cells?
Hi Emma, just a little confused are the green and red splotches on the graphs the fluorescent given off by the antibodies? I’m finding interpreting the graphs confusing. Great vid thanks
Hi Emma... Would you kindly inform me how to measure DNA contents by Flowcytometry
Quick question about flow, how much area on the cell would be blocked by the filter so the detector only detects the periphery of the cells? Thank you very much
outstanding explanation, I'm immunology PhD student, currently i'm using BD Accuri C6 Plus cytometer to analyse PBMC from cattle breed. Unfortenally, i don't have high background on cytometry data analysis and interpretation.
Please, i need a help.
Rest in Peace....He passed away today.
My brother...B/D first FACS machine, Innovated the industry. He invented this process ...also was XY INC. Colorado
final stage VP operations R/D ST Genetics.
@t
Give praise he gave us what we have today.
Thanks to all in the industry...God Speed.
Thank you!!!
How do we determine gating (as in the confidence level of selecting which part of the data to exclude)? Like what are the criterias? Thanks.
This is a great question. Most gating is drawn by hand, so lots of inherent variation. There are often control samples that we can use to set gating thresholds (I.e. an unstained sample compared to an EpCAM-PE stained sample), but again, the exact point is selected by individuals. BUT gates will be copied to all samples, so whatever exact gate is selected will be consistent throughout all the data.
@@EmmaSandy Thank you for the clarification!
If bladder or prostate cancer is suspected, how are the cells taken for testing using flow cytometry?
Hi, thanks for your video.
Can flow cytometry be used for blood typing? I'm a veterinary student and I want to know how I can type dogs blood by flow cytometry. If you have any information I'd appreciate it if you help.
So I don't understand one thing with gating. You take an area of cells you want and test them for another parameter. How exactly do you do that? If I understand right, you can do that only by prior sorting, right? But these areas defined in the graph look like you made them after the cytometry is done, because otherwise, you can tell a computer only ''choose cells that are bigger than X and more granular than Y" and get a square area in the graph, which os not the case. So how does it work?
Yes that's right! I "gate" after the cytometry data is all collected. Just sitting at the computer with my data. My cells are long dead, in the waste tank. But I have all the measurements for each cell that flowed through the machine. Think of gating as selecting only a certain group of cells. Imagine the data is an excel spread sheet. I select only cells with a set value FSC, and I highlight them, then copy and paste to the next tab for further analysis.
If I want to do cell sorting, it's a different machine. I draw gates on the cells live at the machine, to tell it which ones to spit out again.
Hope this helps!
@@EmmaSandy Oh wow, cool, thanks for the answer! Meanwhile I have been introduced to FlowJo for the first time to gate two years old data haha, so that makes sense now. So when a single cell flows through the machine, it tests the cell for ALL the parameters and antibodies you pick at the same time? We want to find Tregs population for example, but from the same data, we can also find T17?
Thank you for the video!
Hey Emma,
I am new to Flow Cytometry and I am also looking at cells in the Lung. I am wondering how do you know where to cut off your debris from your cells of interest in your first plot?
Hi Maria, the lungs are some of the "dirtiest" samples to look at by flow cytometry. I usually set to pseudo colour plots for gating this. I can see the 'hotspot' indicated by pseudocolour plots and I select these as my cells. Anything much lower on the SSC & FSC axis are likely debris in my samples.
May I know how you differenciate between cells and debris?
Thank you for explaining :)
Thanks Anika!
I am from china. Thank you 🎉
Thank you! This is so helpful than my book lol
Dear Sandy, I love watching your video. I am new PhD student who is exploring about flow cytometry. I am using FACs for blood cells analysis and need guidance. I do not have proper guidance right now and wandering if you can spare your time to look at my data for discussion. I don't know how to contact you directly. So, I wrote here and hope you see my message.
Thank youu
What does it mean if cd8/100 cells is a little high?
Hey Emma, thank you for this video, really helpful!! I am still confused about how to gate for specific cell populations? Do each population have its particular gating line?
I am a new graduate student and always have questions haha
That is a great question! I will try to explain.
Each cell type that you want to study on the flow cytometry should be identified by 'marker proteins'. These are usually surface membrane proteins that are unique to that cell type. Scientists have studies these proteins and know each are found on a certain cell type. For example, epithelial cells express 'EpCAM' (epithelial cell adhesion molecule) on their surface. Endothelial cells express 'CD31' protein on their membrane. (note the 'CD' is just a numbering system for proteins of the immune system, it stands for class of differentiation). Macrophages can be identified by 'CD11b' protein on their surface. If our cell is positive for CD31, we can call it an endothelial cell. Search for 'cell markers' and try a cell type to see more examples.
Each cell (or dust particle) that passes through the flow cytometer, only goes through once. We have to collect all of the information at once, as it flows past the lasers. Combining the different lasers at one time, we must collect info on the particle's size, it's granularity, is it expressing CD31, is there DNA present. Then we can dissect all this data to identify only the cells we are interested in by drawing gating lines.
Where to draw gating lines- if we are looking for CD31+ stained cells, we should go to the cytometer with 2 tubes of cells. One with our cells, stained with CD31 antibody, and one which is unstained. We collect data on 10,000 cell from each tube. Then we compare these graphs beside eachother (with CD31 on the axis), we can see where the positive gate should be drawn. Unstained controls are needed in every experiment to know where the gate is drawn.
I hope this helps!
@@EmmaSandy Thanks Emma. It gets quite clear now! This video helps a lot in my tutorial today. Thanks for sharing knowledge in science. 💓
Thank you so much for such an amazing and easy explanation Emma! 🤍
Hello can you help me with flow cytometry calculations?
Is there a class for this
PLS make more of such videos... science related
Thanks Sramona, I'm working on a western blotting video next. Then I think PCRs could be a good topic for the future. If you'd like any specific topics let me know :)
thanks Emma! may i ask what does gating actually mean? are the cells re-passed through the flow cytometer after sorting? or is it just re-plotting the data in the graphs?
To gate cells they do not pass through the cytometer again, the graph is just replotted. Imagine an excel spread sheet with 1 row being 1 cell, you just highlight the ones you're interest them, copy and paste them into a new tab. A new tab = a new gate.
@EmmaSandy thank u so much for the explanation! Really appreciate it 🙏
Thank you for this. I’m doing some gating for algorithm training in the virtual world of Eve online’s Project Discovery of dot histograms. Because I have no axis to base my gates what are some best practices in general gating ways of being both specific and general?
Great question! If you have 'unstained' and 'stained' samples, then I would set the gate at the maximum& beyond the peak of the unstained. That way, any signal you are seeing is not background & you select the true 'positive' cells.
Hi ,what course do u study?
I've got an undergrad degree in immunology.
Hi Emma! Thank you for your video! Im new in FC too and Im working with finding carcinoma cells in serous fluids. I can find them, when I use the proper markers, but I still have doubts as to when I can classify the events in FSC and SSC as heterogenous or homogenous (they are certainly very complex and big, that part i got right, but i also know that carcinoma can sometimes vary in size and complexity). do you know of any bibliography that can explain that?
Hi Vlad, I'm glad the video was useful! I'm not familiar with that field, but one way to search literature is to use google scholar. Try searching for your key words "carcinoma cells in serous fluid facs" in google scholar, then narrow down the publication date (maybe last 10 years) and try (research article only). Also I've been tripped up a few times by using niche key words, so make sure to broaden your search to words others may use, for example you may only ever say "serous fluids" but others could say "serosal fluid; peritoneal fluid" for example. Hope this helps.
@@EmmaSandy Thanks! ill follow your advise :)
how can you differenciate between tetriploid, diploid, haploid etc on a PE-A graph
I'm guessing the PE channel was used to detect the DNA stain propidium iodide? If you set the Y axis to 'histogram', and the X-axis to PE-A, you should see peaks. The first peak will be haploid (smallest DNA, least PI), the next peak should be diploid (double DNA, more PI), and the next peak and so on. That's my best guess, but I'm not familiar with your data. Good luck!
Hi, how can you calculate MFI from flow histogram; my machine is showing me %total, %gated. X-mean, y-mean. Which one is MFI , can you please tell
MFI = mean fluorescence intensity.
So in a histogram your x axis (horizontal axis) usually says fluorescence (i.e. GFP). I'll guess it is X-mean. Take a look at your scale and see if the number makes sense.
Hey Emma can you please explain again if you can in a text what doe we mean gated and ungated?
many thanks !!!
Also for the pseudocolor plot what are the four percentages given, what do they mean?
Selecting a particlular cell of interest is gating.
Hai can anyone help me with cytometry calculations?
Hi! There is a really old MMORPG game called EVE Online, where players can participate in a project, where the play a "mini game" inside the game, where they actually analize flow cytometry data. The aim is to help covid research. The large player base, and the user interface the game designers created, resulted in more than 40million samples analized so far. The problem is, that since the players do not have a specific science degree. The results could be better, if someone, using the in-game UI made a youtube vid, describing HOW to do BETTER in analyzing stuff. Unfortunatelly i did not find any such video. Maybe you could do that? It would help the researchers partnered with the game developers get better data, you could get some views on your channel, and (what i think is most important) spread scientific awareness.