Bayesian Estimation Supersedes the t Test

HTML-код
- Опубликовано: 26 авг 2024
- Highlights from the JEP:General article of the same title. Talk presented at the Psychonomic Society, Nov. 2012. Contents include a brief overview of Bayesian estimation for two groups, and three cases contrasting Bayesian estimation with the classic t test.


Dear Prof. Kruschke, thanks a lot for this incredible presentation! One of the rare presentations that give an easy and intuitive explanation to a complex matter.
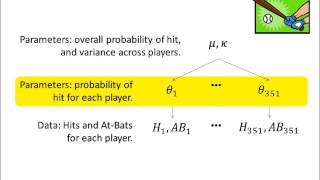
Bayesian methods are great for binary data like proportions. The first half of the book (Doing Bayesian Data Analysis) develops all the fundamental concepts of Bayesian analysis using binary data. For count data and chi-square tests, Chapter 22 provides a Bayesian approach and references to further info.
Hi Nicole, glad it helped. Thanks for your comment!
Looks good. I might look over the r code, and rewrite it in Julia.
Great stuff John. Thanks for putting your time into this clear presentation.
Excellent video John! I'm a proud owner of your book. In the video you suggest that neither Bayes nor NHST should be regarded as more 'correct'. However, we all know that NHST is inherently flawed (stopping rules, etc.) and that Bayes is logically the correct choice- which is important to emphasize given that they lead to two different conclusions for the examples you present. Why be shy about this? ;)
The two approaches ask different questions. Bayesian asks about credibilities of parameter values given observed data, frequentist asks about error rates give hypothetical worlds. Neither question is necessarily the "correct" question to ask, but most people intuitively think they're asking the Bayesian question because they interpret the result in a Bayesian way.
Thanks for the reply, John. Yes, I agree that the two approaches ask different questions, and, as your examples nicely illustrate, can yield different conclusions to inform our decisions. Given the inherent flaws in NHST and the logical coherence of Bayesian inference, which one would you trust more to make decisions? I think I know the answer ;)
If Python is your tool of choice (rather than R), you may be interested to check out our Python implementation of this based on PyMC. It's available at github.com/strawlab/best .
Is there a version of BEST for Matlab?
I'll check it out. I prefer to use Julia, and would like version of this.
great stuff - recommend the Happy Puppies book - although we now refer to it as the "dog book"!
the book got introduced to me as "the dogs" book :D
This is fantastic! Very well explained
Hello , I think the big problem for bayesian is the prior and how to choose them.
I agree with you that bayesian gives more inference compared to frequents as in bayesian you can compute the magnitude of the Null hypothesis.
please I would like to know any vedios that explains how to choose the best prior.
For a conceptual explanation of how to set priors, see this open-access article: Bayesian data analysis for newcomers,
link.springer.com/article/10.3758/s13423-017-1272-1
In particular, see the section headed "Prior distribution: innocuous, hazardous, beneficial".
For a detailed example of setting priors for a realistic yet simple application, see the Supplementary Example for this open access article: Bayesian analysis reporting guidelines,
www.nature.com/articles/s41562-021-01177-7
The Supplementary Example is available here:
osf.io/w7cph/
@@JohannZahneknirsche
Thank you a lot, Prof Kruschke, The only reason that does not make me use the Bayesian approach is the possibility of having a bias in the analysis, the funny part is as I asked myself why the frequency approach does not have a bias as many researchers state, since sometimes the frequency models may not be the correct approach. I asked my professor if I can use the Bayesian approach in my research and he encouraged me to work only with the traditional approach he explained the traditional approach works very well in machine learning compared to Bayesian, but I am curious about how to choose the correct prior, especially for logistics and survival analysis. I want to read more about the bayesian approach and I may buy one of your books soon🙂
I encouraged you to make new videos prof, I found your explanation very clear and let us make this channel active again.
Best regards,
Amin
how to explain the green numbers in the plot 3.6%
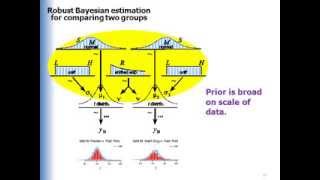
That's just the percentage of the distribution below 0 and above 0. That annotation could have been omitted.
I have a question about interpreting the results from the example with small N. I see that the 95% HDI includes 0, so it makes sense that we would not reject the null hypothesis. However the green text in the output reads "3.6% < 0 < 96.4%". What does this refer to?
My previous assumption was that 3.6% referred to the entire distribution and that for any x < 5%, x < 0 < 1-x would indicate a significant difference in means.
So, is a distribution used in the model?
... the best fitting t- and N- distributions have different means?? (2:40)
Yes.
Hi John, thank you so much for this. It is very useful. I have a question regarding BESTexample.R
I downloaded you package an followed instructions, and ran the above example sucessfully. I then tried to run it on my own data, but first I thought I'd fiddle the example data. I divided one of the data vectors by ten
y2=y2*0.1
and re-run the script, expecting the analysis to indicate that the estimate for muDiff was non-0 with high credibility. But [HDIlow,HDIhigh] for muDiff includes 0; why is this? Do I need to give different initial prior values?
Dear Linford: Have you looked at the new data? Are the sample means closer together than they were before? (There should be no need to change the priors, because the scripts make the priors broad relative to the scale of the data.)
@@JohannZahneknirsche Hi John, thanks for your reply. The sample means are much further apart than they were (~90 units), which is why I was expecting [HDIlow,HDIhigh] for muDiff to not include 0.
Any advise on this John?