How to Set Stop Losses with ATR Indicator (Like a PRO)

HTML-код
- Опубликовано: 14 май 2024
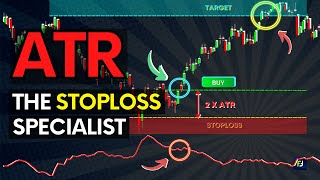
- Average True Range or the ATR indicator is the best indicator you can use for setting a stop-loss. #atr #stoploss #tradingjournal
How to read Japanese candlesticks: • How to Read Japanese C...
How to Trade Moving Averages: • How to Trade Moving Av...
If you have any questions please leave a comment.
Also, please leave a comment about any video you want me to make.
Binance referral with %10 discount: www.binance.com/en/register?r...
Click to buy the best cryptocurrency wallet ever: shop.ledger.com/?r=060174241c06
The easiest way to buy cryptocurrencies with your credit card: cex.io/r/0/up110275514/0/
THIS IS NOT INVESTMENT ADVICE. I am not a financial advisor, videos in this channel are just for educational purposes.
If you follow my channel, you know that I always talk about the importance of stop-losses. It is true that, if you want to be a profitable trader, you must use stop-losses while trading. But an important question comes to mind:
“How do you decide your stop-loss points?”
Well, for new traders, it is a complicated subject. But, with the ATR indicator, even a newbie can put a stop-loss like a pro trader.
It is the Trading Journal channel, and please don’t forget to subscribe for more trading and investing videos.
Before starting to explain how you should use the ATR indicator, I want to show you how you can find the ATR indicator in your charting software. I am using tradingview.com in this video. To add the Average True Range to your charts, you should click on this button at the top menu. And we will search for the Average True Range. Now you can see the ATR indicator below your price chart.
As you can see, the ATR indicator has got a single line. Now, let’s see how we should read the Average True Range indicator. If you have watched our former videos about the Japanese candlesticks, you should remember, what is the range of the candle. You can see a Doji candle here. The range is simply the high of the candle, minus the low of the candle. So let’s say that, for the stock X, the highest price of the day is 100 dollars and the lowest price of the day is 97 dollars, the range of the day, and of the candle is 3 dollars.
The true range is a little bit different than the normal range. if there is no gap between the candle and the previous one, it is calculated the same way as the range. However, if there is a gap between the candles, it uses the previous day's close point. So the average true range is either the highest minus the lowest price, or it is the highest minus the previous close price, whichever is the greatest. Also in red candles, it can be calculated by subtracting the low from the previous candles closing price.
As you can guess from the name, the Average True Range indicator shows us the average of ranges for a specific period of time. By default settings, the ATR indicator shows us the average of ranges for the last 14 candles. If you are looking at daily charts, it shows the average of ranges within 14 days. If you are looking at the hourly chart, it is an average of 14 hours. You can change these settings if you want, but I use it with the default settings.
Now, you know how the ATR indicator is calculated. Let’s focus on how you can use it while trading. First, ATR shows us the volatility. If it is low, down here, it means that ranges are small. So, it means that the price hasn’t changed much. But, if it is high above here, it means high volatility. Because it means that there were big price movements in the last 14 candles, it can indicate that we can see some big candles in the future. So, basically, ATR shows us how much the price has changed relatively on average in one period. ATR does not give buy or sell signals, it just shows how much the market you are looking at moves.
Okay, the first feature was to show the volatility, but it is not the reason we are using the ATR for. We use the ATR to set stop-losses. While opening a trade, you should check the ATR. And you should never open a position without a stop-loss. So, you can put your stop-loss with the help of the ATR indicator. ATR indicator solves one of the biggest problems while trading. ATR indicator is used to set the stop-losses at the right place. One of the biggest mistakes new traders do is to set their stop-losses too tight. If you put your stop-loss too tight, the price can hit your stop-loss before it goes in your favor. So you lose a trade even if you are %100 right to open it.


I must say you are the best at explaining indicators on all of RUclips. No doubt that all your videos are excellent!
Such a clear and straightforward way to explain this!!!! I have watched many videos and even took notes. I ended up not even understanding my notes because things were being explained in such a complex way. But I understood your explanation very well and now my previous notes even make sense to me now lol. Thank you!!!
Glad it was helpful! Remember that only people who don't know something explain it complex
Please keep teaching complex things in a easy way. Stay healthy and THANK YOU‼️🤗
THANK YOU for the quick and clear explanation of the ATR, I wasted 1 hour on other youtube videos about the ATR that told me nothing about how to actually use itr.
you didn't waste any thing, you got experience on who to chose so you don't make the same mistake again
really great simplified explanations. thank you.
You are welcome!
Thanks for the great content!
Glad you enjoy it!
I been looking at ATR videos because supposedly the pros use it. So, it's a must. This video has the best explanation, but I think I'm still lost on how to calculate the numbers on the subchart you circled when trading options.
I use and average of atra from say thr last 10 days at thr same time(the open has higher volatility than any other time of day) using atr on the opening drive will set you up for any Volatility below that time of day, also use a time frame that is typically 3 times the time frame that you trade on i like a 3 minute chart So i use the ATR of a 15 minute bar If a 15 minute bars range is something that i can stomach as far as a stop lost goes then being able to trade it on a 3 minute chart gives me a lot more time before i know that I'm wrong sometimes i don't even make it to the stopLoss because the price action on the lower time frame tells me that I'm in the wrong direction. When you re working with atr averages it allows you to adjust to when the market speeds up and slows down. You wouldn't drive 30 mph on a 70mph road, by the same token if you're taking an off ramp and it says 40mph you wouldn't go 60 on the ramp, you'll flip the car.. I'm rambling lol I've made a video about it, just checking out what others say in the topic
Very helpful video. Thank you!!!
You're welcome!
Superb explaining in simple words...
Thanks for uploading video...sir...
Glad you liked it!
Best explanation. I've watched a couple of videos, I still couldn't understand what they are meaning 😅
Thanks have a good day
Thank you very much !!!
You are welcome!
in the example for BTCUSD at 5:10 we read ATR(14) on H1 chart is 96.34 so roughly 90$, using tradingview tool to set the short trade we can move the SL that we can see rougly amount - 90$. BUT if we set trade with broker what does not support plaform tradingview to set trade positions, we have to work with pips, how can we change $ into pips? On MT4 I can read the today right now at 6:58 GMT ATR(14)=6.0979, while tradingview's ATR(14) average true range shows 5.55 and ATR in pips (ATRPIPS by lazybear) shows 2.95 why there are so much discrepancy, which ATR value here is suitable for SL? and if the tradingview average true range is the only trustworthy value how can I convert 5.55$ into pips value? Is 5.55$ correct at all when I see in the video about 2 yrs ago the ATR value was 90$ but now only 5.5$ BTCUSD is less volatile now? Does it seem not disturbant to you?
thanks for helping
Happy to help! Any time
I use the ATR and I still get smoked by the market. Many times the market hits the atr stop loss and bounced back to my original trade.
double the value of the atr by 2
Watch his double divergence video. Use this to find entries. Enter on morning/evening start at support/resistance on lower timeframe. Money.
Trading forex with daily chart how often price trades outside 80% of daily ATR on a given day? Daryl Guppy did a study on this issue.Thank you.
I enjoy it, thanks but do you know someone Pro and Profitable traders using 1ATR as stop loss and never less than that?
Thank you for explaining this concept!
Thank you
You're welcome
nice
Thanks! Very clear, I am gonna use it ^-^
For a long trade, if an ATR is of 2 points then, is ATR should be considered from previous candle close or previous candle low ?
previous candle low + ATR
Thanks a million for your invaluable content.. it's just wonderful
Glad you enjoy it!
thousand like for that Crystal clear explanation
Your voice is the same with the guy in tradingrush channel
Thanks from sri lanka 🇱🇰 🌱🗺️✈️🌈️✨️⏳🌏💼✍️📉📖️💲💰🌳💡♥️
You're most welcome, I am planning to visit Sri Lanka soon ♥️
Next time trying to make video clear view with indicators. Dark background with dark indicators, doesn't get clear view.
Noted! thanks
The title should be : what is ATR
Or how to talk 5 min and loose people time
Hello can someone please help....i am trading the eur/usd on the 5 minute timeframe and my atr red number is showing a decimal (0.00037) and not a dollar amount? how do I fix this please?
i am also wondering this