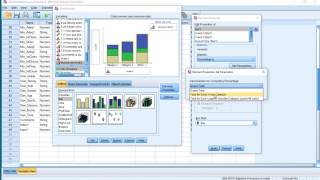
Stacked bar graph: How to percentage a cluster or stacked bar graph in SPSS 25

HTML-код
- Опубликовано: 22 авг 2024
- Tutorial on how to create a stacked bar graph of multiple variables that each uses percentage values. This tutorial will basically show you how to percentage a cluster or stacked bar graph in SPSS 25 and the chart-builder or cross tab to create the chart.


Thanks for this I was stuck with my data not knowing how to proceed, now being sorted. thanks
Thanks for sharing fox
Anyone can help me please im unable to select all the variables.
how can i stack blue and red as one bar and orange and green as one bar
Dear Amongh Lilledar, thanks for your concern. I will make a video and tag you so that you see how you can use SPSS to stack bars as one (%)