Corrections: 8:53 I meant to say "the remaining 198.7 people without the mutated gene". 14:27 I correctly wrote "If the tests worked as expected, 5% should have p-values less than 0.05". That is correct. However, when recording the voiceover, I said "5% should have p-values less than 0.5", which is not correct. NOTE: In statistics, machine learning and computer programming, the default base for the log() function is 'e'. Thus, throughout this video I use the natural logarithm, or log base 'e', to do the calculations. Support StatQuest by buying my books The StatQuest Illustrated Guide to Machine Learning, The StatQuest Illustrated Guide to Neural Networks and AI, or a Study Guide or Merch!!! statquest.org/statquest-store/
@@MM-jm1il I believe it is because the derivative of ln(x) is super simple, just 1/x. Likewise, the derivative of the exponential function, e^x, is e^x.
I've been excelling at math without understanding such fundamentals of statistics which I've been silently ashamed of. Your materials have significantly improved my understanding. Hats off to you sir. Thank you.
It is amazing how many math students who are advanced in math and algebra lack very basic foundation in statistics. Your materials are highly valuable. It’s like the Neanderthals discovering fire.
As a full-time machine learning engineer, I must say I love the animations and your clear concise explanations! Your videos really helped me understand the fundamentals to succeed in my field. Thank you
I think this is a good piece of trivia! I'm not 100% it is correct - I don't know off the top of my head when the first small bam showed up, but this could be it. :)
@@statquestthis is the first appearance of “small bam” to the best of my knowledge - I watched the videos from the oldest forward in the past month (😂) and I think I haven’t seen it’s appearance anywhere before this one. Now I feel like an 11 year old groupie girl 🤪
This is so helpful, I have been struggling about log(odd ratio) for a while, the meaning of log part confuses me forever, just never get why log is necessary for the calculation, now I finally understand, thank you so much
Great video! I needed this refresher. Very clear and concise! A point of clarification: at approximately 14:18 the voice over says that "...5% should have p-values of less than 0.5." I believe you meant "less than 0.05" as the slide shows. I wanted to clarify for listeners.
Brilliant stuff Josh.... I keeep coming back to your video again and again... only to find that there is more and more information which I missed to grasp earlier .. Loving Statquesting.
I wrote an R script to generate the histogram alluded to by Josh at 10:00. For people following along in R this might be of use, so I figured I'd share it. Thank you for your work Dr. Starmer :bow: # StatQuest: Odds Ratios and Log(Odds Ratios), Clearly Explained!!! Josh Starmer # Steps to reproduce the histogram for Wald's Test in R # Author: Evan Rushton # Date: 09/22/18 logOdds
Fantastic video, as always clearly explained! One minor point of confusion - for the Wald simulated histogram, in each iteration of the loop, a **single sample** of size N is selected. Then, as stated in the video and as commented in @evanrushton1's R code below, a random number between 0 and 1 is selected, and if the number is < 0.08, the **sample** is described as 'having cancer'; however, in the code, this command generates a vector, of size N, containing N random numbers between 0 and 1, which seem to instead represent the probability that each **person** in the sample has cancer. Same for the **sample** having the mutation vs **each person in the sample** having the mutation...as each iteration of the loop generates a 2x2 table containing integers representing the number of **persons** in each cell, from which to calculate log(OR). Apologies if this is semantic but this distinction confused me in the video and as such, it wasn't obvious to me how to turn those sample-based probabilities into a loop until I saw the code (and thanks to both Josh and Evan for sharing their R code). Does anyone have a simple explanation if this confused them as well?
Odds of something is itself a ratio (probability of it happening/probability of it not happening) The odds are usually odds of x given y (in this case the odds of getting cancer given that you do have a gene) Log odds ratio is a ratio of ratios (ratio of the log odds) but the given condition changes. This tells us if the “given” condition has an effect on the odds of x happening. Example: 3:40 Log odds ratio = (log odds of getting cancer | you have the gene) / (log odds of getting cancer | you don’t have the gene) This can tell us the effect of the given condition (given you have the gene vs given you don’t have the gene) on the odds of x happening (cancer vs no cancer)
would be great to have a video differentiating odds ratios from relative risk from hazard ratios. in terms of interpretation and when one is used instead of the other
First of all, thanks for this series! It's cool how Wald's test can show relationship or absence of it. But we got the distributions of cancer people and mutated people independently, meaning we said that 8% of samples have cancer and 39% of samples have mutated gene. As I look at names of features ("cancer", "mutated gene"), I am biased to believe that there is a relationship. But if the 2nd feature had the name "wearing green shoes", I would assume there is no relationship and the wald's test would still show p value
small mistake 8 minute 50s :expected values for Chi-square should be in the second row (for no mutated gene) 17.8 - cancer and 198.2 for no cancer. It's easy to check without computing cause they should add up to integers totals under each column but anyway great video and thank you for your work
How did you get 17.8? When I multiply the number of people that do not have the mutated gene, 216, by the probability that someone will have cancer, 0.08, I get 17.3.
I tried adding a "card' link to the Fisher's Exact test (this is a pop-up link that shows up at the right time in the video), but maybe something went wrong with it. Regardless, I added a link to the StatQuest in the description, and here it is as well: ruclips.net/video/udyAvvaMjfM/видео.html Happy StatQuesting!!!
Hi Josh. Just started watching your videos. Currently going through your 'Statistics Fundamentals' playlist. In this video, at the 7:50 mark, you mention 'So, if the gene is not associated with the 140 people with the mutated gene...', shouldn't the assumption be that 'So, if we assume that cancer is not associated with the 140 people with the mutated gene...'. That's the only reason you used the expected value using the 'estimated' population probability of having cancer (0.08) to calculate the 'expected value' of the number of people having both the mutated gene (140) and cancer.
Here is the code in Python to generate the histogram at 10:10. But one thing I would like to raise is that it seems not necessary to have random sample size as you can notice that it would be cancelled out when calculating the odd ratios. import numpy as np import matplotlib.pyplot as plt n = 1000000 sample_size = np.random.rand(n)*100+300 #Sample size ~ uniform disturbution between 300 and 400 p1 = np.random.rand(n) #p1 = proability with cancer ~ uniform distribution between 0 and 1 p2 = np.random.rand(n) #p2 = probability with gene mutation ~ uniform distribution between 0 and 1 odd_ratios = (sample_size*p1*p2 / sample_size*(1-p1)*p2) / (sample_size*p1*(1-p2) / sample_size*(1-p1)*(1-p2)) log_odd_ratios = np.log(odd_ratios) plt.hist(log_odd_ratios,bins=np.arange(-10,10.5,0.5))
At 13:50 of the video, the p-value that mutated genes does not have relationship with cancer is 0.00005. So does it mean that mutated genes has a strong association with cancer then? P.S: It would be great that each time when you give an example, you will have a conclusion to it, so it wouldn't be confusing. Great video!
You are correct - I should have had a more obvious conclusion to this example. Often I do, but I forgot in this case. The small p-value says the association isn't just due to chance or noise. How strong that relationship is, however, is determined not by the p-value, but by the log(odds ratio). In other words, if we had a small log(odds ratio) and small p-value, we would have a significant, but weak association. If you have a large log(odds ratio) and a small p-value, you have a significant and strong association.
To calculate the p-value, we estimate the mean and standard deviation of a normal distribution and then we the area under that curve to calculate the p-value.
Hello Josh, I had a confusion at 12:02 in the video. You said that the - "Wald's test typically uses the estimated standard deviation" ; but in reality we replaced the histogram with the normal curve having standard deviation of the observed values i.e 0.47. Hence, shouldn't it be - "Wald's test typically uses the observed standard deviation" instead of the expected and then we have a normal curve of STD=0.47 at 12:02. Based on my understanding the expected standard deviation will come from the earlier matrix of expected values which we calculated and here we have used the observed values matrix for getting a STD of 0.47. Let me know if I am missing something, but I am kind of lost in this section of the video and could use your help. Thanks again for an amazing video.
13:20 However, this is traditionally done using a standard normal curve (i.e. a normal curve with mean = 0 and standard deviation = 1). I am a little bit confused about the word "traditionally". Are you saying that the log(odds ratio) is not necessarily distributed according to standard normal distribution?
Ah. The log(odds ratio) is normally distributed, but the standard deviation is not always 1. Traditionally, you convert the distribution for the log(odds ratio) to a standard normal curve (mean = 0, sd = 1) by dividing by the standard deviation (which you calculate using the method of your choice). I say "traditionally", because that's how you had to do solve for the p-value back in the day. You had a table of values for a standard normal curve in the back of some book, and whenever you needed a p-value for a normal curve, you converted your normal distribution to a standard one (by subtracting the mean and dividing by the sd) so you could reference the table in the back of the book. These days, however, a computer can calculate the p-value for any normal curve, so it's not really important to transform to a standard normal distribution any more (however, everyone still does it).
One other point this applies to a case where the dependant variable is categorical because when the dependant variables is continuous we would use an F value to determine whether the model is significant
Just to clarify for myself regarding fisher’s exact test - to calculate the p value we are calculating the sum of probabilities of getting >= 23 cases of cancers if we are choosing 140 (= 23 + 117) people from the total 356 (= 23 + 117 + 6 + 210) people, is my understanding correct? I have only used fisher’s exact test in school when sample size is really small and all the cases can be laid out in a table by hand, and have never done in using a software package. I know scipy has a fisher_exact function but admit I haven’t read its docs or used it. Is there an R package that you would recommend using for doing it? Thanks as always 😊
Hi Josh, I just wanna make sure that I'm correct. Now you assume there is no relationship between gene and cancer, and the log(odd ratio) equal to 0 means no relationship at all. Then based on what you observed from an experience, the log odd ratio is 1.93, and the p-value is something extremely small given that there is no relationship, which means it is really rare to happen when there is no relationship. But it does happen, so we need reject that there is no relationship, and accept that there is a relationship between gene and cancer. Am I correct? really confused.
The small p-value tells us that it would be vary rare for random chance to give us the observed log(odds ratio). Thus, we reject that the observed log(odds ratio) is due to random chance. Does that make sense?
Your music gives me Fitz and the Tantrums vibes, which I am enjoying. A question: In this example you used a 2 x 2 contingency table and calculated the odds ratio for the positive response (cancer with a mutated gene). In my case, lets say *hypothetically* I am tracking the rate at which surgeons perform 2 procedures, A and B, over the past 10 years.
I can calculate the odds of procedure A and procedure B and then find the odds ratio. In order to say the odds are changing, what statistic would I use?
Fisher's exact test and the Chi-square test could work well with this data (they would tell you that the proportions between procedures A and B change).
I was taught that when I see the equation log(x) to assume the base of the logarithm is 10. If I want to do logarithm with base e, I have always written ln(x). It took me a while to figure out why my math didn't work out the same as in the video.
It's unfortunate that the conventions for what log() means are not consistent. In statistics, machine learning and computer programming, the default base for the log() function is 'e'. Thus, throughout this video I use the natural logarithm, or log base 'e', to do the calculations.
@@statquest Thanks a lot. I noticed this when I used the log function in R. I am reviewing statistical principles as I write my prospectus for my Master's thesis and your videos are extremely useful.
Hi Josh - Many thanks for your videos. At 10:46 - This gives the matrix that did not depend on the relation between mutated gene and cancer. If there is no relation, matrix itself cannot be formed rite ? Because as per my understanding - in a matrix, the margin totals proportion cannot vary at any cost rite ? I have one sample where I'm stuck to form a matrix - 1. Sample size - 366 2. Random number for cancer b/w 0 to 1 - 0.19 3. Random number for mutated gene b/w 0 to 1 - 0.14 Also will log() result in negative number ? I could see only positive number output when I apply log(). Please clarify
When we make a matrix that is only dependent on the over all proportion of people with cancer and the overall proportion of people with the mutated gene, and not the known proportion of people with cancer AND the gene, then the matrix will not depend on the relation between the gene and cancer. Also, as you can see on the x-axis in the histogram, the log can give us negative numbers.
@@statquest thanks Josh...understood.. so matrix margin sum for random numbers should add to 325 rite both row wise and column wise instead of all 4 cells adding up to 325 or any number b/w 300 and 400 ?
@@KishoreKumar-fv2cx Because we are randomly deciding how many samples have cancer, the column and row totals will always be different. However, the total for the entire matrix will the number between 300 and 400 that you came up with at the start.
Thanks a lot for your wisdom!!! I have one question, as the odds ratio in the example was = 6.88 and the p-value was = 0.00005, we can say that there is a relationship between the mutated gene and cancer? or in other words, that having a mutated gene increases the odds of having cancer?
p-value wording is super awkward. Technically we would just say that we reject the hypothesis that there is no relationship. However, there is still a small probability that there could be no relationship.
I love your vids. I don’t know where to begin when I look at the number of quality videos on your channel. Is there an organization of the videos that would help?
Hi Josh, thanks for uploading those lectures! I really appreciate that! I’m still confused on why we use z values in logistic regression. Is this the reason that we use log odds which has mean of 0 and symmetrically distributed? Or more fundamentally(?), because our response variables are ‘binomial’? Thanks so much!
I'd suggest that we use z-value because wald test uses it to calculate whether the variable (predictor) in logistic regression is zero (null hypothesis) or not (alternative hypothesis). If the variable's Z-value (according to Wald Test) in logistic regression is less than some value (for example -+1.96 which equals to 2 std. deviations) we can drop that variable from the logistic regression because it's useless. Hope my answer helps you after 2 years :D
@@statquest - Yes, I did. The video was really good so I wanted to practice it in R. I couldn't see if anyone else had already posted something like this. I'm happy to delete/edit if needed.
Hi Josh we need a clearly explained statquest on Fisher Test, chi square test and wald test . It will be triple BAM!!! if hypergeometric distribution is explained Can you also show to a demo to do these using python notebook
Hi Josh, at time stamp 13.59 you say that p-value that mutated gene does not have a relationship with cancer is 0.00005 which means that there is no relationship between mutated gene and cancer and the result of log(odds ratio) is not statistically significant. Now if I understand correctly, at time stamp 12.53, it is written that log(odd ratio) is statistically significant which means that mutated gene and cancer has significant relationship. Can you pse tell what am I missing here.
The p-value for the hypothesis that there is no relationship between the mutated gene and cancer is 0.00005. This means that we reject the hypothesis that there is no relationship between the mutated gene and cancer. To learn more about what p-values mean and how they are interpreted, see: ruclips.net/video/vemZtEM63GY/видео.html and ruclips.net/video/JQc3yx0-Q9E/видео.html
Thanks for the awesome video. Just had a question as to how are Odds Ratios different from Relative Risk and when to use Odds Ratios and when to use Relative Risk ?
Hi again, at 13:59 does it means: there is "no" relationship between mutated gene and cancer due to small effect size or small log(odds-ratio), which is although significant. Because I got confused at the result as odds ratio is positive in favor of mutated gene.
The small p-value tells us to reject the hypothesis that there is no difference. To learn more about how to interpret p-values in general, see: ruclips.net/video/vemZtEM63GY/видео.html and ruclips.net/video/0oc49DyA3hU/видео.html
Just a heads up Josh, The Fisher's Exact Test video is not in any of the playlists for your videos. I found it by googling it, but just in case folks don't think about that solution.
Hi Josh, at 10:24 how did you draw the sample for histogram? You iterate thru 325, each time you draw random to determine which of the 4 cell it should be? (yesyes, yes no, no yes, no no) ? from your step instruction, it looks like I can only determine all cancer column and all mutated row, but I cannot derive the whole 4 cells for matrix. Many Thanks!
For each sample, if the first random number is less than 0.08, then the sample has cancer, otherwise it does not. If the second random number is less than 0.39, then it is mutated, otherwise it is not.
@@statquestMany thanks! I figured out too and confirmed with some python code. one more question 14:14, what you mean by the content from this point on? You generated 10000 log(ratio) data points based on observed expected probability (0.08 and 0.39). And it's not standard normal. How you apply test on it? Previously in your content Fisher's and Chi Square and even Wald's they all work on 2x2 matrix, how you manage them to apply on a normal distribution? How did you exactly calc p-value for example Chi and Wald's based on your generated 10K log(ratio)s? Quite confused here. Please advice at your convenience, really appreciate it!
@@kevinshao9148 I generated a single matrix of values then then I applied the Fisher, chi-square, Wald's tests to it to get the p-values for the three tests. I then repeated the process, 10,000 times, and then calculated the percentage of p-values < 0.05 for each test.
Hi Josh! I have a question. At 11:25, you mentioned that "it is more common to estimate the standard deviation from the observe values"-- Does that mean the histogram generated from 10:00 to 11:25 is only for illustration purpose? i.e., it is not part of the Wald test calculations, am I right? =)
Thank you for this great presentation. It seems to me that there is an error at the timing of 8:53. You saying that " 198.7 people with mutated gene are..". It supposed to be " 198.7 people WITHOUT mutated gene ...". Please check this. Thanks
We pick two numbers. We check to see if the first number is < 0.08. Then we check to see if the second number is < 0.39. So we don't check to see if the same number is < 0.08 and < 0.39.
Dear Josh, Thanks for such awesome videos!!. In this video, what do you exactly mean by 3%/4% of the times you got p-value ? P-value less than 0.05 actually means there exists a relationship between independent and dependent variables. But, I could not understand, what does this 3% of the times you got this p-value mean? Please clarify!!
The definition of a p-value is actually a little different from what you wrote. A p-value less than 0.05 means that if there is no relationship between the independent and dependent variables, then 5% of the time we do the exact same experiment we will get results as extreme or more extreme. In other words, a p-value < 0.05 tells us that if there is no relationship between the independent and dependent variables, what we observed would be rare, but not impossible. Typically we interpret the p-value by saying "since it would be very rare to see what we see if there is no relationship, we can reject the hypothesis that there is no relationship and conclude that there must some sort of relationship". So, in my video I wanted to compare three different statistical tests. To do this, I generated a lot of random datasets that had no relationship between the independent and dependent variables. I then applied each method to each random dataset. If the tests worked well, then 5% of the time they should result in p-values < 0.05. Does that make sense?
@@statquest What I could understand is that p-value is the probability of the null hypothesis, so the boring hypothesis. In this case the boring hypotesis is "there is no relationship between cancer and the mutating gene". So if we get p
@@statquest you didn't discuss at the end of each test (even if they have a similar result) the "biological result". You gave us the p-value and then you disappeared :(
@@alessandro49946 The biological result is that the mutated gene has a relationship with cancer, however, is that biologically relevant? That's the question. And since I'm not a cancer doctor or researcher, I can't answer that question. Experts in the field have to decide for me.
I just have a question(basically two) for you Josh, I went through all of the videos of yours and they are literally clearly explained and It's quite easy to apprehend for me. But the thing is that after completing all of the videos it's hard for me to remember everything. I noted everything but seems like I tend to forget a lot of things. Is that natural? Or in that case, what should I need to do? I really want to be a machine learning engineer and researcher as well and I'll apply for fall22 for Ph.D. in the USA. So, it looks overwhelming and at the same time enthralling to learn new stuff.
Jot your own notes do help. Even if you just remember the rough idea later, it is much easier to pick up by reading the notes. Using some modern notes jotting software like Notion give you extra BAM.
Hi Josh, very great video, really appreciate your videos very much. I have a question regarding the estimation of standard deviation in the wald test. You said in the video that it is more common to estimate the standard deviation from the observed values. But I don't understand why the standard deviation is calculated by the square root of the sum of 1 over each observed values. May I ask for an explanation on that as I am quite confused on this part in this video. Thank you very much and sorry for the inconveniences caused.
This video talks about odds ratios and log(odds ratios), not log odds, so that might be confusing you right there. If you want to learn about log(odds), see this StatQuest instead: ruclips.net/video/ARfXDSkQf1Y/видео.html
2:43 - im struggling to understand why we devide 23 over 117 instead of 23 over 140 which is the sum of all ppl who have the gene (likewise 6/216 for no gene). note: the rounded numbers are the same but still... please help - what am i missing?
When we divide 23 by 117 we get the odds. If we divide 23 by 140, we get the probability. In this case, we are interested in the odds and not the probability, so we divide by 117. For more details on the difference between odds and probabilities, see: ruclips.net/video/ARfXDSkQf1Y/видео.html


Corrections:
8:53 I meant to say "the remaining 198.7 people without the mutated gene".
14:27 I correctly wrote "If the tests worked as expected, 5% should have p-values less than 0.05". That is correct. However, when recording the voiceover, I said "5% should have p-values less than 0.5", which is not correct.
NOTE: In statistics, machine learning and computer programming, the default base for the log() function is 'e'. Thus, throughout this video I use the natural logarithm, or log base 'e', to do the calculations.
Support StatQuest by buying my books The StatQuest Illustrated Guide to Machine Learning, The StatQuest Illustrated Guide to Neural Networks and AI, or a Study Guide or Merch!!! statquest.org/statquest-store/
thanks for clarification. tiny bam!
Why do we take the natural log vs log base 10?
@@MM-jm1il I believe it is because the derivative of ln(x) is super simple, just 1/x. Likewise, the derivative of the exponential function, e^x, is e^x.
Chi Squared test!!
@@speakers159 Noted!
I've been excelling at math without understanding such fundamentals of statistics which I've been silently ashamed of. Your materials have significantly improved my understanding. Hats off to you sir. Thank you.
Thanks! :)
It is amazing how many math students who are advanced in math and algebra lack very basic foundation in statistics. Your materials are highly valuable. It’s like the Neanderthals discovering fire.
Thanks!
As a full-time machine learning engineer, I must say I love the animations and your clear concise explanations! Your videos really helped me understand the fundamentals to succeed in my field. Thank you
Wow, thanks!
Graduate students across the globe thank you for these excellent videos. Top marks sir.
And graduate students and PhD ones damn sure need statistics understanding for machine learning
This is the best series of stats videos I have ever seen happening on youtube. You sir is a legend
Thank you so much!!! I'm so happy to hear that you like the videos. :)
Five years later and I still feel this is absolutely true!
With videos like these, the odds of learning something are good, and it's easy to log a lot of time here!
TRIPLE BAM! :)
Actually StatQuest is on my mind all night long
BAM! :)
First time continuously watching 10 videos in a series without any break. 10 x BAM.
OMG!!! Total binge! BAM! :)
This contained the first reference (that I've seen) to "small Bam". This is important StatQuest trivia!
I think this is a good piece of trivia! I'm not 100% it is correct - I don't know off the top of my head when the first small bam showed up, but this could be it. :)
historians will take note
@@statquestthis is the first appearance of “small bam” to the best of my knowledge - I watched the videos from the oldest forward in the past month (😂) and I think I haven’t seen it’s appearance anywhere before this one.
Now I feel like an 11 year old groupie girl 🤪
@@arenashawn772 So it is confirmed! TRIPLE BAM! :)
This is so helpful, I have been struggling about log(odd ratio) for a while, the meaning of log part confuses me forever, just never get why log is necessary for the calculation, now I finally understand, thank you so much
Glad it helped!
Great video! I needed this refresher. Very clear and concise! A point of clarification: at approximately 14:18 the voice over says that "...5% should have p-values of less than 0.5." I believe you meant "less than 0.05" as the slide shows. I wanted to clarify for listeners.
Thanks for catching that. I just added a pinned comment with that note so that it will be easy to find by future viewers.
This is such an underrated channel! Thanks again for saving my life lol
Bam!
Brilliant stuff Josh.... I keeep coming back to your video again and again... only to find that there is more and more information which I missed to grasp earlier ..
Loving Statquesting.
Hooray!!! I'm glad you keep learning more and more. :)
You are the man Josh. Wish I had a teacher like you when I was in school.
Thank you so much!! I'm glad you like the videos. :)
I wrote an R script to generate the histogram alluded to by Josh at 10:00. For people following along in R this might be of use, so I figured I'd share it. Thank you for your work Dr. Starmer :bow:
# StatQuest: Odds Ratios and Log(Odds Ratios), Clearly Explained!!! Josh Starmer
# Steps to reproduce the histogram for Wald's Test in R
# Author: Evan Rushton
# Date: 09/22/18
logOdds
This is awesome!!!!! Nice work. :)
Fantastic!!! I will tray to grasp every passage, I am a novice to R. Thank You Evan.
Man I love the intro song to your video, so calming... my exam is on 15th of April pray for me guys...
Another confusion clarified, thanks Josh.
BAM! :)
Thanks!
TRIPLE BAM!!! Thank you for supporting StatQuest!!! :)
OMG it's so... CLEARLY EXPLAINED!!!
BAM! :)
Fantastic video, as always clearly explained! One minor point of confusion - for the Wald simulated histogram, in each iteration of the loop, a **single sample** of size N is selected. Then, as stated in the video and as commented in @evanrushton1's R code below, a random number between 0 and 1 is selected, and if the number is < 0.08, the **sample** is described as 'having cancer'; however, in the code, this command generates a vector, of size N, containing N random numbers between 0 and 1, which seem to instead represent the probability that each **person** in the sample has cancer. Same for the **sample** having the mutation vs **each person in the sample** having the mutation...as each iteration of the loop generates a 2x2 table containing integers representing the number of **persons** in each cell, from which to calculate log(OR).
Apologies if this is semantic but this distinction confused me in the video and as such, it wasn't obvious to me how to turn those sample-based probabilities into a loop until I saw the code (and thanks to both Josh and Evan for sharing their R code). Does anyone have a simple explanation if this confused them as well?
Thanks!
U r a god in explaining difficult things so easy
Thanks a lot 😊
My most awaited topic, thank u very much.
Big fan😊
Hooray!!! You're welcome. I'm glad you like the video! :)
This channel is gold
Thank you!
(waiting for that statquest on chi-square test) but still thank you
my son or daughter will watch your videos when they grow up.
:)
You deserve waaaay more subscribers!
Thank you very much! :)
Hey Josh--looking for a great explanation of odds ratios for my students, and bam ! there you are. Please say hi to Jack for me!
BAM!!! Wow! It's Al Bardi!!!! Cool. I'll definitely pass the word on to Jack.
Thanks for another great video! Looking forward to the StatQuest about the Chi-square test))
It's coming!
Came for the content, stayed for the intro
bam!
I have one word for your videos, Lucid!
Thank you! :)
Think about people with cancer as delicious m&ms... this made me laugh
:)
Thanks for this rich content, best educational video about machine learning, youre the best!!!
Wow, thanks!
Horray,
I've made it to the end of the stats playlist ...
triple bam! :)
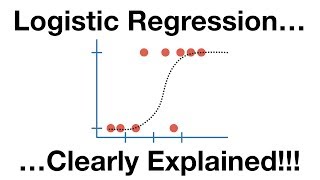
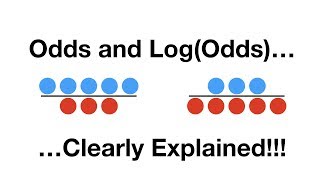
Odds of something is itself a ratio (probability of it happening/probability of it not happening)
The odds are usually odds of x given y (in this case the odds of getting cancer given that you do have a gene)
Log odds ratio is a ratio of ratios (ratio of the log odds) but the given condition changes. This tells us if the “given” condition has an effect on the odds of x happening.
Example: 3:40
Log odds ratio = (log odds of getting cancer | you have the gene) / (log odds of getting cancer | you don’t have the gene)
This can tell us the effect of the given condition (given you have the gene vs given you don’t have the gene) on the odds of x happening (cancer vs no cancer)
would be great to have a video differentiating odds ratios from relative risk from hazard ratios. in terms of interpretation and when one is used instead of the other
I'll keep that in mind.
First of all, thanks for this series! It's cool how Wald's test can show relationship or absence of it. But we got the distributions of cancer people and mutated people independently, meaning we said that 8% of samples have cancer and 39% of samples have mutated gene. As I look at names of features ("cancer", "mutated gene"), I am biased to believe that there is a relationship. But if the 2nd feature had the name "wearing green shoes", I would assume there is no relationship and the wald's test would still show p value
That's interesting. I guess you have to try to ignore the names. Maybe just label them "a" and "b".
small mistake 8 minute 50s :expected values for Chi-square should be in the second row (for no mutated gene) 17.8 - cancer and 198.2 for no cancer. It's easy to check without computing cause they should add up to integers totals under each column
but anyway great video and thank you for your work
How did you get 17.8? When I multiply the number of people that do not have the mutated gene, 216, by the probability that someone will have cancer, 0.08, I get 17.3.
Good explainer!
Glad you think so!
You're the best, Josh!
De nada! :)
brahhh we need a dedicated chi square lecture D: plssss
I'll keep that in mind.
Good job, man
Thanks!
Many thanks Josh! It would be more convenient if you add the link to your video about Fisher's exact test.
I tried adding a "card' link to the Fisher's Exact test (this is a pop-up link that shows up at the right time in the video), but maybe something went wrong with it. Regardless, I added a link to the StatQuest in the description, and here it is as well: ruclips.net/video/udyAvvaMjfM/видео.html
Happy StatQuesting!!!
Amazing video. Could you please, one day, make a video explaining why the standard deviation is the inverse of the observed values? Thank you!!:)
I'll keep that in mind.
Hi Josh.
Just started watching your videos. Currently going through your 'Statistics Fundamentals' playlist.
In this video, at the 7:50 mark, you mention 'So, if the gene is not associated with the 140 people with the mutated gene...', shouldn't the assumption be that 'So, if we assume that cancer is not associated with the 140 people with the mutated gene...'.
That's the only reason you used the expected value using the 'estimated' population probability of having cancer (0.08) to calculate the 'expected value' of the number of people having both the mutated gene (140) and cancer.
Yes, that's a typo. It should be "If cancer is not associated with the 140 people with the mutated gene."
This clarification was desperately needed. My head was spinning trying to make sense out of typo text, where none could be made
this video is fecking amazin
:)
Here is the code in Python to generate the histogram at 10:10. But one thing I would like to raise is that it seems not necessary to have random sample size as you can notice that it would be cancelled out when calculating the odd ratios.
import numpy as np
import matplotlib.pyplot as plt
n = 1000000
sample_size = np.random.rand(n)*100+300 #Sample size ~ uniform disturbution between 300 and 400
p1 = np.random.rand(n) #p1 = proability with cancer ~ uniform distribution between 0 and 1
p2 = np.random.rand(n) #p2 = probability with gene mutation ~ uniform distribution between 0 and 1
odd_ratios = (sample_size*p1*p2 / sample_size*(1-p1)*p2) / (sample_size*p1*(1-p2) / sample_size*(1-p1)*(1-p2))
log_odd_ratios = np.log(odd_ratios)
plt.hist(log_odd_ratios,bins=np.arange(-10,10.5,0.5))
bam
At 13:50 of the video, the p-value that mutated genes does not have relationship with cancer is 0.00005. So does it mean that mutated genes has a strong association with cancer then?
P.S: It would be great that each time when you give an example, you will have a conclusion to it, so it wouldn't be confusing. Great video!
And how did you get 0.00005 p-value anyway? It's an estimate value you gave based on the normal distribution?
You are correct - I should have had a more obvious conclusion to this example. Often I do, but I forgot in this case. The small p-value says the association isn't just due to chance or noise. How strong that relationship is, however, is determined not by the p-value, but by the log(odds ratio). In other words, if we had a small log(odds ratio) and small p-value, we would have a significant, but weak association. If you have a large log(odds ratio) and a small p-value, you have a significant and strong association.
To calculate the p-value, we estimate the mean and standard deviation of a normal distribution and then we the area under that curve to calculate the p-value.
Excellent
Thanks!
Excellent video! Thnx for the work!
You're welcome! :)
Great stuff.. thanks a ton!
Thanks!
Perfect! Thank you so much! really grateful for clear explanation best statistics series on youtube
Hooray! You're welcome! :)
Hello Josh, I had a confusion at 12:02 in the video. You said that the - "Wald's test typically uses the estimated standard deviation" ; but in reality we replaced the histogram with the normal curve having standard deviation of the observed values i.e 0.47. Hence, shouldn't it be - "Wald's test typically uses the observed standard deviation" instead of the expected and then we have a normal curve of STD=0.47 at 12:02. Based on my understanding the expected standard deviation will come from the earlier matrix of expected values which we calculated and here we have used the observed values matrix for getting a STD of 0.47. Let me know if I am missing something, but I am kind of lost in this section of the video and could use your help. Thanks again for an amazing video.
In this situation "estimated" means "estimated from the observed data", so the estimated standard deviation comes from the observed data.
Thank uuuuuuuuuuuuuu soooooo much 😊😊😊😊😊😊😊😊😊
You are so welcome!
You're amazing!!!!!!
Thank you!
Sir u are the best..!!
Thanks! :)
13:20 However, this is traditionally done using a standard normal curve (i.e. a normal curve with mean = 0 and standard deviation = 1). I am a little bit confused about the word "traditionally".
Are you saying that the log(odds ratio) is not necessarily distributed according to standard normal distribution?
Ah. The log(odds ratio) is normally distributed, but the standard deviation is not always 1. Traditionally, you convert the distribution for the log(odds ratio) to a standard normal curve (mean = 0, sd = 1) by dividing by the standard deviation (which you calculate using the method of your choice). I say "traditionally", because that's how you had to do solve for the p-value back in the day. You had a table of values for a standard normal curve in the back of some book, and whenever you needed a p-value for a normal curve, you converted your normal distribution to a standard one (by subtracting the mean and dividing by the sd) so you could reference the table in the back of the book. These days, however, a computer can calculate the p-value for any normal curve, so it's not really important to transform to a standard normal distribution any more (however, everyone still does it).
Thank you so much for making it clear.
One other point this applies to a case where the dependant variable is categorical because when the dependant variables is continuous we would use an F value to determine whether the model is significant
Just to clarify for myself regarding fisher’s exact test - to calculate the p value we are calculating the sum of probabilities of getting >= 23 cases of cancers if we are choosing 140 (= 23 + 117) people from the total 356 (= 23 + 117 + 6 + 210) people, is my understanding correct?
I have only used fisher’s exact test in school when sample size is really small and all the cases can be laid out in a table by hand, and have never done in using a software package. I know scipy has a fisher_exact function but admit I haven’t read its docs or used it. Is there an R package that you would recommend using for doing it?
Thanks as always 😊
Yes, that is the idea. And Fisher's exact test is built into R: fisher.test(). So you can get help with ?fisher.test
wow, I love you man
:)
Hi Josh, I just wanna make sure that I'm correct. Now you assume there is no relationship between gene and cancer, and the log(odd ratio) equal to 0 means no relationship at all. Then based on what you observed from an experience, the log odd ratio is 1.93, and the p-value is something extremely small given that there is no relationship, which means it is really rare to happen when there is no relationship. But it does happen, so we need reject that there is no relationship, and accept that there is a relationship between gene and cancer. Am I correct? really confused.
The small p-value tells us that it would be vary rare for random chance to give us the observed log(odds ratio). Thus, we reject that the observed log(odds ratio) is due to random chance. Does that make sense?
Your music gives me Fitz and the Tantrums vibes, which I am enjoying.
A question: In this example you used a 2 x 2 contingency table and calculated the odds ratio for the positive response (cancer with a mutated gene). In my case, lets say *hypothetically* I am tracking the rate at which surgeons perform 2 procedures, A and B, over the past 10 years.
So my table is Procedure A, Procedure B x 2010, 2011, 2012....2020.
I can calculate the odds of procedure A and procedure B and then find the odds ratio. In order to say the odds are changing, what statistic would I use?
Fisher's exact test and the Chi-square test could work well with this data (they would tell you that the proportions between procedures A and B change).
To infinity (and beyond!) nice
Thanks!!!! :)
I was taught that when I see the equation log(x) to assume the base of the logarithm is 10. If I want to do logarithm with base e, I have always written ln(x). It took me a while to figure out why my math didn't work out the same as in the video.
It's unfortunate that the conventions for what log() means are not consistent. In statistics, machine learning and computer programming, the default base for the log() function is 'e'. Thus, throughout this video I use the natural logarithm, or log base 'e', to do the calculations.
@@statquest Thanks a lot. I noticed this when I used the log function in R. I am reviewing statistical principles as I write my prospectus for my Master's thesis and your videos are extremely useful.
Josh, great content, at 7.50 should it be "if cancer is not associated with the people with the mutated gene" ? Am confused 🤔!
Since we're looking at the data in terms of the rows, we are thinking about the gene's association with cancer.
thank you
:)
Hi Josh - Many thanks for your videos. At 10:46 - This gives the matrix that did not depend on the relation between mutated gene and cancer. If there is no relation, matrix itself cannot be formed rite ? Because as per my understanding - in a matrix, the margin totals proportion cannot vary at any cost rite ? I have one sample where I'm stuck to form a matrix -
1. Sample size - 366
2. Random number for cancer b/w 0 to 1 - 0.19
3. Random number for mutated gene b/w 0 to 1 - 0.14
Also will log() result in negative number ? I could see only positive number output when I apply log(). Please clarify
When we make a matrix that is only dependent on the over all proportion of people with cancer and the overall proportion of people with the mutated gene, and not the known proportion of people with cancer AND the gene, then the matrix will not depend on the relation between the gene and cancer. Also, as you can see on the x-axis in the histogram, the log can give us negative numbers.
@@statquest thanks Josh...understood.. so matrix margin sum for random numbers should add to 325 rite both row wise and column wise instead of all 4 cells adding up to 325 or any number b/w 300 and 400 ?
@@KishoreKumar-fv2cx Because we are randomly deciding how many samples have cancer, the column and row totals will always be different. However, the total for the entire matrix will the number between 300 and 400 that you came up with at the start.
Thanks a lot for your wisdom!!!
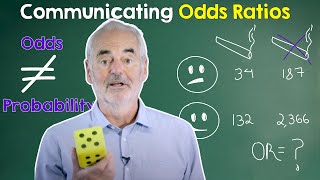
I have one question, as the odds ratio in the example was = 6.88 and the p-value was = 0.00005, we can say that there is a relationship between the mutated gene and cancer? or in other words, that having a mutated gene increases the odds of having cancer?
p-value wording is super awkward. Technically we would just say that we reject the hypothesis that there is no relationship. However, there is still a small probability that there could be no relationship.
I love your vids. I don’t know where to begin when I look at the number of quality videos on your channel. Is there an organization of the videos that would help?
I have them organized all of the videos on my home page: statquest.org/video-index/
Hi Josh, thanks for uploading those lectures! I really appreciate that!
I’m still confused on why we use z values in logistic regression. Is this the reason that we use log odds which has mean of 0 and symmetrically distributed?
Or more fundamentally(?), because our response variables are ‘binomial’?
Thanks so much!
I'd suggest that we use z-value because wald test uses it to calculate whether the variable (predictor) in logistic regression is zero (null hypothesis) or not (alternative hypothesis). If the variable's Z-value (according to Wald Test) in logistic regression is less than some value (for example -+1.96 which equals to 2 std. deviations) we can drop that variable from the logistic regression because it's useless. Hope my answer helps you after 2 years :D
All the video, I was thinking about the families of people having cancer.
# Possible R code corresponding to video (there might be mistakes or better ways to do it!)
# Load data
cancerData
Did you write that?
@@statquest - Yes, I did. The video was really good so I wanted to practice it in R. I couldn't see if anyone else had already posted something like this. I'm happy to delete/edit if needed.
Thanks
any time!
Thank you for existing!!! How do I buy one of your songs?
Hooray!!! You can get my music here: joshuastarmer.bandcamp.com/
Thank you so much!!!
Hi Josh we need a clearly explained statquest on Fisher Test, chi square test and wald test . It will be triple BAM!!! if hypergeometric distribution is explained
Can you also show to a demo to do these using python notebook
ruclips.net/video/udyAvvaMjfM/видео.html
Hi Josh, at time stamp 13.59 you say that p-value that mutated gene does not have a relationship with cancer is 0.00005 which means that there is no relationship between mutated gene and cancer and the result of log(odds ratio) is not statistically significant. Now if I understand correctly, at time stamp 12.53, it is written that log(odd ratio) is statistically significant which means that mutated gene and cancer has significant relationship. Can you pse tell what am I missing here.
The p-value for the hypothesis that there is no relationship between the mutated gene and cancer is 0.00005. This means that we reject the hypothesis that there is no relationship between the mutated gene and cancer. To learn more about what p-values mean and how they are interpreted, see: ruclips.net/video/vemZtEM63GY/видео.html and ruclips.net/video/JQc3yx0-Q9E/видео.html
Thanks for the awesome video. Just had a question as to how are Odds Ratios different from Relative Risk and when to use Odds Ratios and when to use Relative Risk ?
Hi again, at 13:59 does it means: there is "no" relationship between mutated gene and cancer due to small effect size or small log(odds-ratio), which is although significant. Because I got confused at the result as odds ratio is positive in favor of mutated gene.
The small p-value tells us to reject the hypothesis that there is no difference. To learn more about how to interpret p-values in general, see: ruclips.net/video/vemZtEM63GY/видео.html and ruclips.net/video/0oc49DyA3hU/видео.html
Just a heads up Josh, The Fisher's Exact Test video is not in any of the playlists for your videos. I found it by googling it, but just in case folks don't think about that solution.
Thanks for the tip. I'll see what I can do about getting it on a playlist.
What test(s) do we use to establish whether a BAM!! is small or not?
Great question!!!
Hi Josh, at 10:24 how did you draw the sample for histogram? You iterate thru 325, each time you draw random to determine which of the 4 cell it should be? (yesyes, yes no, no yes, no no) ? from your step instruction, it looks like I can only determine all cancer column and all mutated row, but I cannot derive the whole 4 cells for matrix. Many Thanks!
For each sample, if the first random number is less than 0.08, then the sample has cancer, otherwise it does not. If the second random number is less than 0.39, then it is mutated, otherwise it is not.
@@statquestMany thanks! I figured out too and confirmed with some python code. one more question 14:14, what you mean by the content from this point on? You generated 10000 log(ratio) data points based on observed expected probability (0.08 and 0.39). And it's not standard normal. How you apply test on it? Previously in your content Fisher's and Chi Square and even Wald's they all work on 2x2 matrix, how you manage them to apply on a normal distribution? How did you exactly calc p-value for example Chi and Wald's based on your generated 10K log(ratio)s?
Quite confused here. Please advice at your convenience, really appreciate it!
@@kevinshao9148 I generated a single matrix of values then then I applied the Fisher, chi-square, Wald's tests to it to get the p-values for the three tests. I then repeated the process, 10,000 times, and then calculated the percentage of p-values < 0.05 for each test.
Hi Josh! I have a question. At 11:25, you mentioned that "it is more common to estimate the standard deviation from the observe values"-- Does that mean the histogram generated from 10:00 to 11:25 is only for illustration purpose? i.e., it is not part of the Wald test calculations, am I right? =)
You are correct. The histogram just illustrates how it works.
Thank you for this great presentation. It seems to me that there is an error at the timing of 8:53. You saying that " 198.7 people with mutated gene are..". It supposed to be " 198.7 people WITHOUT mutated gene ...". Please check this. Thanks
Oops!! That's a mistake. I've add it to the pinned comment.
For the matrix at 10:46, I am a bit confused as to how the count for "people who have cancer but NO mutated gene" came to be?
Because, any value
We pick two numbers. We check to see if the first number is < 0.08. Then we check to see if the second number is < 0.39. So we don't check to see if the same number is < 0.08 and < 0.39.
@@statquest Ahh ok, thanks a lot for the explanation.
Dear Josh,
Thanks for such awesome videos!!. In this video, what do you exactly mean by 3%/4% of the times you got p-value ?
P-value less than 0.05 actually means there exists a relationship between independent and dependent variables.
But, I could not understand, what does this 3% of the times you got this p-value mean?
Please clarify!!
The definition of a p-value is actually a little different from what you wrote. A p-value less than 0.05 means that if there is no relationship between the independent and dependent variables, then 5% of the time we do the exact same experiment we will get results as extreme or more extreme. In other words, a p-value < 0.05 tells us that if there is no relationship between the independent and dependent variables, what we observed would be rare, but not impossible. Typically we interpret the p-value by saying "since it would be very rare to see what we see if there is no relationship, we can reject the hypothesis that there is no relationship and conclude that there must some sort of relationship".
So, in my video I wanted to compare three different statistical tests. To do this, I generated a lot of random datasets that had no relationship between the independent and dependent variables. I then applied each method to each random dataset. If the tests worked well, then 5% of the time they should result in p-values < 0.05. Does that make sense?
@@statquest What I could understand is that p-value is the probability of the null hypothesis, so the boring hypothesis. In this case the boring hypotesis is "there is no relationship between cancer and the mutating gene". So if we get p
@@statquest you didn't discuss at the end of each test (even if they have a similar result) the "biological result". You gave us the p-value and then you disappeared :(
@@alessandro49946 You are correct.
@@alessandro49946 The biological result is that the mutated gene has a relationship with cancer, however, is that biologically relevant? That's the question. And since I'm not a cancer doctor or researcher, I can't answer that question. Experts in the field have to decide for me.
I just have a question(basically two) for you Josh, I went through all of the videos of yours and they are literally clearly explained and It's quite easy to apprehend for me. But the thing is that after completing all of the videos it's hard for me to remember everything. I noted everything but seems like I tend to forget a lot of things. Is that natural? Or in that case, what should I need to do? I really want to be a machine learning engineer and researcher as well and I'll apply for fall22 for Ph.D. in the USA. So, it looks overwhelming and at the same time enthralling to learn new stuff.
I have a terrible memory and forget stuff all the time. Focus on remembering the main ideas.
Jot your own notes do help. Even if you just remember the rough idea later, it is much easier to pick up by reading the notes. Using some modern notes jotting software like Notion give you extra BAM.
I confuse, in your video at 11:57 why you re using theta 0 as distribution? In other video i saw they re using theta hat as distribution
The null hypothesis is that there is no relationship among the different categories which implies that the mean of the log(odds ratios) should be 0.
Hi Josh, very great video, really appreciate your videos very much.
I have a question regarding the estimation of standard deviation in the wald test. You said in the video that it is more common to estimate the standard deviation from the observed values. But I don't understand why the standard deviation is calculated by the square root of the sum of 1 over each observed values. May I ask for an explanation on that as I am quite confused on this part in this video. Thank you very much and sorry for the inconveniences caused.
That's just the equation for the standard deviation when you have this type of data. To explain how it is derived would take a whole video.
Your Presentation is very good and Interesting. Can I know what software do you use in preparation of the video.
I Like your voice..........
I used to use powerpoint and iMovie. Now I use Keynote and Final Cut Pro. However, this video in particular was done using Keynote and iMovie.
Josh! is it possible you can write a small definition / explanation of what log odds are, i still dont get it and im desperate!!!!! help ):
This video talks about odds ratios and log(odds ratios), not log odds, so that might be confusing you right there. If you want to learn about log(odds), see this StatQuest instead: ruclips.net/video/ARfXDSkQf1Y/видео.html
hello sir ..please make a video on chi square test and wald test
Do you want more than what I say at 9:27
@@statquest Yes sir , I am having difficulty to grasp it . If you can then please make a video.
@@mid1chosen noted
Nice tutorial! Thank you. Can I ask how do you create this slides?
Thank you! For details on how I make these videos, see: ruclips.net/video/crLXJG-EAhk/видео.html
2:43 - im struggling to understand why we devide 23 over 117 instead of 23 over 140 which is the sum of all ppl who have the gene (likewise 6/216 for no gene). note: the rounded numbers are the same but still... please help - what am i missing?
When we divide 23 by 117 we get the odds. If we divide 23 by 140, we get the probability. In this case, we are interested in the odds and not the probability, so we divide by 117. For more details on the difference between odds and probabilities, see: ruclips.net/video/ARfXDSkQf1Y/видео.html
that was fast! thx a bunch!@@statquest
At time stamp 7.55, the statement should be "so, if the is not associated with (23 + 117) = 140 people with mutated gene, then..."
Other than grammatical errors, I'm not sure how your version is different from mine. Can you clarify?
great job !!!! I would like to ask for similar videos that explain Metropolis Hasting algorithm. thank you :)
That's a great idea! I'll add it to my "To-Do" list.
Hello, it was somewhat difficult to me, especially in the case of tests. Thanks
I hope my video helped! :)
11:27 Why estimated SD from observed data = sqrt(1/count_00 + 1/count_01 + 1/count_10 + 1/count_11) ?
That would take a whole StatQuest to explain.
this is awesome
Josh, you are the fucking man!
Thanks! :)
11:49-Wald Test Working
yep