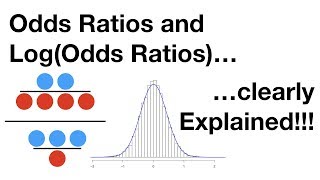
Odds and Log(Odds), Clearly Explained!!!

HTML-код
- Опубликовано: 1 июн 2024
- The odds aren't as odd as you might think, and the log of the odds is even simpler! This StatQuest covers those subjects so that you can understand the statistics for true/false type problems (like Logistic Regression).
For a complete index of all the StatQuest videos, check out:
statquest.org/video-index/
If you'd like to support StatQuest, please consider...
Buying The StatQuest Illustrated Guide to Machine Learning!!!
PDF - statquest.gumroad.com/l/wvtmc
Paperback - www.amazon.com/dp/B09ZCKR4H6
Kindle eBook - www.amazon.com/dp/B09ZG79HXC
Patreon: / statquest
...or...
RUclips Membership: / @statquest
...a cool StatQuest t-shirt or sweatshirt:
shop.spreadshirt.com/statques...
...buying one or two of my songs (or go large and get a whole album!)
joshuastarmer.bandcamp.com/
...or just donating to StatQuest!
www.paypal.me/statquest
Lastly, if you want to keep up with me as I research and create new StatQuests, follow me on twitter:
/ joshuastarmer
#statquest #statistics


NOTE: In statistics, machine learning and many programming languages, like Java, R and Python, the default base for the log function is 'e'. So log(0.17) = "log base e of 0.17" = -1.77. The natural log (log to base 'e') is used because it often simplifies the mathematics that underpins statistics. That said, you can use whatever base you would like as long as you are consistent.
Also, at 10:00, I say that a histogram of the log(odds) has the shape of a normal distribution, but what I should have said is that the shape is *similar* to a normal distribution and is *approximated* with a normal distribution.
Lastly, people often ask about how to generate the normal distribution: First, I randomly selected a number between 1 and 100 and I get 32. That means I will use 32 as the numerator for the odds. The denominator is then 100-32 = 68. Then I calculate the log(32 / 68) and get -0.75 (because I use log base 'e', but you can use any log base as long as you are consistent). Then I pick another random number between 1 and 100 and get 54. This means that the numerator for my odds is 54 and the denominator is 100-54 = 46. So I calculate the log(54 / 46)=0.16. Then I just repeat that process a bunch of times (100s) and draw a histogram of the log(odds) values. If I do this, I will get a normal distribution.
Support StatQuest by buying my book The StatQuest Illustrated Guide to Machine Learning or a Study Guide or Merch!!! statquest.org/statquest-store/
StatQuest with Josh Starmer If I may suggest, you should use "ln" instead of "log", I came to your video simply because machine learning is something new to me it's not to assume everyone knows the assumption you gave. In fact when someone wrote "Log" I would have to look at the base whether if it's "e" or 10 at the base.
@@harley4640 On newer videos I make it explicit that I'm using the base 'e'.
to add: on a calculator you can also type in 'log(1.7) / log(e)' to calculate the log using the base 'e'
@@statquest But why the log(odds) will be close to a normal distribution? The central limit theorem does not apply in this case.
@@ting-chiehhuang6937 That's a good question.
GIVE THIS GUY A MEDAL!!!
I understand more about logs than in the 4 years I studied for logs in my final exams for different levels of examinations!
Thank you!!!! :)
thank you for helping me to spend my quarantine times effectively. the world is a much better place with mathematics!
Awesome!!! I'm glad you're getting something positive out of the quarantine. :)
It's like beauty of nature
This comment really took me back...
NOTE: Odds are not probabilities. So if the definition of "odds" seems odd to you, just keep watching. It will all make sense in less than 2 minutes.
I definitely would liket to make friends with you and let's talk about predicting pick3
What is the problem if there is assymetry? 7:25
Wow haha. At first, I felt like....WHAT. Where is Josh getting this math?! Then I saw this comment, watched a little more, and realized...oh....I just don't know what the word "odds" means...
Josh ! I'm french and I believe the intro song is from Renaud. Which of his songs is it from ? If it's not from him, which song did you get the inspiration from ?
I've been searching for days for this song but can't find it. Thank you !!
This got me laughing out loud... here I was checking the comment section to see if I was going mad as everyone ignored it. Thanks a ton.
Some RUclips channels really deserve an award. Thank you, Josh, for putting your teaching skills available to the world!
Thank you very much! :)
I have a really bad statistics professor who has made me want to give up on my way to becoming a data scientist. But you give me faith Josh, that really means something! I’m not giving up thanks to you
You can do it!
Exactly how stats should be taught, intuitive explanation and then the math. Unfortunately, it is taught backwards, encouraging brute and route memorization without understanding the principles. Thank you for taking the time to enlighten us all. God bless u!!!
Thank you! :)
Fantastic video. A teacher who actually builds life-long intuition. Thanks, Josh!
Thank you! :)
The odds of learning something when watching your videos are very high!
bam!
I wish your videos existed during my years as a stat major :( you're really good at explaining things!! I appreciated my college lessons because of you. Thank you. Anyway, this would help me with ML concepts. My takeways:
1. Odds and prob are not the same
2. Odds can be calculated from prob
3. We use log odds to solve for assymetry
Nice! :)
Greetings from Australia. I'm in an advanced research methods course and was struggling to understand log odds, probabilities, and the differences. I was mostly mixed up about the difference between odds and probabilities and didn't even realize it. Thank you so much! I'm sharing this with classmates. I wanted to let you know that this is making a difference for students literally around the world! :)
Awesome!!! :)
I agree...stats is very poorly explained at university level...I only got thru by rote.... unfortunately. And the textbooks don't explain well. Often they just..present ...you with the formula, and somehow you're expected to understand.
statquest is just so freaking good. this and also your videos on regression, boosting and xgboost have given me more clarity on the topics than any other resource I've seen
Thank you very much!
Thank you so, so much. I've been confused about odds & log(odds) for the past 3 years since learning about them. I finally understand them now.
It's crazy how intuitive and clear you make this. You're a remarkable educator. Considered doing just straight up mathematics lectures? That would be pretty sweet.
One day.
I just found you a couple weeks ago and have already seen most of your videos. With you everything's clearly connected: from log(odds) to Xgboost. Thanks!!
Awesome! I'm glad you like my videos. :)
subscribed. I went through 4 years of psych stats without understanding what a logistic regression is... I just use it.. now I feel like I'm finally receiving a worthwhile education from you!
Hooray! :)
Man. I'm really, really thankful with you. You no have idea how useful and helpful is your content to me and my job. Your work is amazing! Thanks!
Awesome! I'm glad to know my videos are helpful. :)
BAM!!!!! thank you so much for your great asset!!! I really happy to meet you and I've been improving my knowledge of statistic methods thanks to you!!!!!!!!!
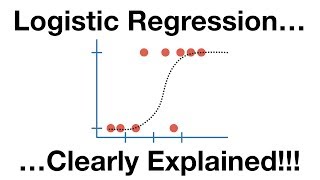
I came here from your logistic regression details 1....and NOW the logit fxn makes so much sense.
Josh, thanks for going slowly and step by step...it really helps in understanding. I like how you explain everything. So few textbooks do that...and so you have a very imperfect understanding...just rote learning.
Thanks!
I'm glad you like the videos! :)
@@statquest Thanks, Josh. You've got such great content...and explain SO well....and not overly simplified... which can also be a problem (not for you, obviously,).
The last example..pairs of numbers adding to 100...to illustrate use of log(odds)..that WAS a bit confusing...I didn't really understand how it works. Choose prs? Another example would be better 😜..
Thanks
From JHB in South Africa.
@@tyronefrielinghaus3467 All we want in that last example is a way to randomly select numbers (and, thus, random log(odds) values) that are related by the sample size. So the sample size, total, is 100, and then we see all the random log(odds) values we can get if the sample size is fixed at 100.
"Clearly Explained" should be "super clearly explained, so clear as if it is transparent" 🙂 Thank you! You are the best!
This channel is amazing. I think this is quality education! You will change the world! Can you imagine a world where most people would have access to teachings like those from Josh Starmer? Would people not make more informed decisions, would people not be better prepared for the future? Why don't we have this type of content on television?
Thanks! :)
Sir, you are a legend. I just discovered your RUclips channel, it's a treasure to me. Thank you so much for your great videos.
Wow, thanks!
I am 30 years old, and finally because of you I have understand it...
I'm grateful
Hooray!
You explained it like none other, its very easy to grasp the concept. Thank you, Josh!
Glad it was helpful!
Josh you were awesome. I have been teaching for the past 32 years (not stat or math but botany/biology) but it feels like it is still a long way to go when I watched such a splendid, extraordinary, marvelous.... well I don't have words for it.... explanation. It was simply magnificent. Needed the meaning of odds and the log odds for my Bioinformatics class (which I am also learning) and I stumbled upon your video. Problem solved to perfection. Looking forward to watching more...sorry can't buy your songs.
Thanks! Good luck with learning Bioinformatics! :)
for this topic, I don't think if any other source could be as helpful as your video. Thanks a ton Josh!
Glad you think so!
Josh, you are a very talented teacher. Thanks so much for this video.
I appreciate that!
Thanks at ton!! The fine difference between ODDs and Probability is a concept often not clear for many!! This is was really helpful
Great to hear!
This is the most useful and straight-forward explanation video I have found. Thank you!
Glad it was helpful!
You have a unique simple way of teaching. Thank you 👍🏻
Thank you! :)
Probability and statistics never come easy to me, but this is so simple, enjoyable and informing at the same time! Thank you so much! :)
Thanks!
I love your videos so much. I have my statistics exam in two days, and if it weren't for your videos I wouldn't be able to prepare at all!! So easy to understand. Thank you so much!
Thank you and good luck on your exam! Let me know how it goes. :)
StatQuest with Josh Starmer thank you, I will!
@@statquest it went a lot better than I expected!!! Thank you so much🥰
@@user-cv7lk1yj4c Hooray! That's great news. :)
@@user-cv7lk1yj4c Are you Chinese or Japanese.
INFINITY BAM!!! I think I just found a gold mine!!! Subscribed!!!
Excellent! Much better than my teacher! Thanks!
Hooray! I'm glad the video was helpful. :)
I just randomly click into this video, didn't expect that I will understand the intuition behind a logit function!!
Bam! :)
9:46
Simulate the distribution of the log of odd (log prob_happen/prob_not_happen)
1. Randomly pick a pair of numbers between 0 and 1.
2. If they sum up to 1, then keep them, else drop. So that the number pairs retained would be [0.x, 1 minus 0.x]. The ratio between the two numbers is an odd.
3. Plot histogram of log(odd), using all the number pairs. The distribution will be normal.
:)
Wow really amazing explanation. I recently completed the machine learning course by Ng, now this video just made everything click!
Hooray! :)
thank you so much for making this video, it is so clear and helpful for me since i don't have any previous knowledge of it
Glad it was helpful!
Josh, you are simply excellent. You make concepts so simple and explain it with lots of visuals. Odds are no longer odd for me :)
Hooray!!! :)
Josh you're saving my life here with all your videos... thanks brother!
Glad you like them!
precisely the video that I needed! This is like the third time I am leaving a comment on youtube. Thank you StatQuest!!
Glad I could help!
It is just excellent your explanation! Thank you so much for such a qualified video!
Hooray!!! I'm glad you like the video. :)
Brilliant explanation as always, couldn't get through this master's degree without you!
bam! :)
If only my high school teaching was this simplified, thank you very much.
Happy to help!
this guy is so good at explaining
Thanks!
Congratulation. It is an amzing video; I understodd many things that always remain a little bit obscure in statistic courses.
Glad it was helpful!
haha same here! Seriously what a boost to productivity it was finding Statquest. Thanks Josh! Excellent intro song to this one - one of my faves so far
Thank you very much! :)
Why did I take so long to find this channel? Congrats.
Thanks!
The explanation at 9:30 is the whole point of this video. Thank you.
:)
I wish your videos were available during my undergrad, could have achieved much good GPA. Keep up the good works!
Thank you very much! :)
This video series is fantastic - keep up the good work.
Thank you! :)
This channel is a pedagogical gold mine
Thanks!
I dont know how to thank you enough, I am passing my finals because of you.
Awesome!!!! I'm so glad to hear you are doing well on your finals. Good luck! :)
Awasome man, your are explaining everything very clearly. I want to say this thanks for responding to everyone's comment, This is the first time I seeing in RUclips.
bam! :)
Very beautifully explained! Thank you so much! 🎉
BAM! :)
I'm from India, your explanation was superb 😀
Thank you!
Simple explanation. Anybody can understand it. Thanks a lot.
Brilliant explanations! Thx Josh, I finally get it😁
bam!
Great video, I was wondering if you can clarify a method by which to determine if a Fixed-Effect or Random-Effect model should be used for logistic analysis? I know for linear analysis a Hausman test can be used, but I am not sure which test to use to determine if I should use FE or RE for my logit analysis. Thanks!!
Josh, thank you so much for your work. I have learned so much from your awesome videos. They have been a great help in refreshing my statistics and learning new methods! Could you do a video on survival functions? :)
That is on the to-do list, and with your vote, I'll bump it closer to the top. I hope to get to it this spring.
Oh snap. I always conceptualized odds and probability as exactly the same thing. I am now in an existential crisis. The world around me no longer makes sense. Why oh why did I come here … :(
Dang! :)
@@statquest - I took emergency measures. I broke out Excel and computed several odds, then probabilities, then logs of odds, then, wait for it, a normal distribution histogram from random numbers. Crisis passed, the world is right again. You never really understand something until you do the math!
Btw: I thought you should know. Log odds distributions has replaced 42 for the answer to the question of life, the universe, and everything. Please write a song. Tx.
@@nicholas1460 Ha! You made me laugh out loud. Nice! :)
I struggled to understand this a computer science student :') You are sent from heaven. Thank you!
Happy to help!
Incredibly good explained !
Thank you!
Lets take 4 statquest lectures: The Probability of understanding is 4/4 =1, the probability of NOT understanding 0/4=0. So, the odds of understanding is the ratio of understanding to the ratio of NOT understanding, in other words it is The Probability of understanding over the Probability of NOT understanding, which is 1/0 = infinite.
Conclusion. If You take Josh's statquest lectures the Probability of understanding is 1 and the Odds of understating is INFINTE. Triple Bam!!!
BAM! :)
Dear Josh,
Your series is increadible. Thanks to you I am not afraid of distributions anymore!
I also have a question about this video, at 2:22 you give for example of writing a probabliity "i.e. my team winning AND losing", shouldn't it be "my team winning OR losing"?
Sorry for being so
inquisitive but I'm just curious. Once again, thanks for the great source of knowledge. Your job is amazing and please, keep it going! THANKS!
I could have worded that differently, but the idea was that the denominator contains the number of times my team won AND the number of times my team lost.
@@statquest Okay, I get it know. I was looking more from the side of set theory and thought about conjuction of those happenings. Thank you very much! :)
Love you 3000 BAM!!! Josh for making learning so easy. Thanks a lot Sir!
Thank you! :)
We all use your channel to clarify doubt in my college. From India
BAM! :)
Double and Triple BAM 😂
Thanks Buzz Lightyear for another amazingly well explained video! Particularly your lead up and explanation of the log(odds), brilliant!
Thank you very much!!!! :)
I love you! You literally perfectly describe everything.
Thank you!
This video was extremely useful. Thanks for sharing
Glad it was helpful!
YOU ARE LIFE SAVER! I can't say THANK YOU enough
Thanks! :)
Thank you so much, helped me clarify a lot
:)
You are the bombb! Sir Starmer... Thanksss a million!
sir, you and your videos are truly awesome.
Thank you so much. :)
The BEST explanation. Thank you!!!
Hooray!!!! I'm so glad you like it! :)
Excellent explaination sir☺️🤜🤛 You are the Best😊
Thanks! :)
Thanks Josh. COVID-19 has helped us become more productive. I appreciate greatly the work you guys at StatQuest do. Thanks alot.
Thank you very much!!! :)
Superb explanation!
Thank you!
BAM!!! I just become a member :) The odds and log(odds) were indeed clearly explained.
Hooray! Thank you very much! :)
What my tutor could not make me understand in 3 lectures, you did it in 11 minutes!
This video itself deserves Quadruple BAM!!!
(Thanks)^'e'
Wow, thanks!
That intro alone has be hooked
bam!
I finally get it, which I did not get even after 4 years of college. Best teacher🙏
Hooray!!! :)
The explanation cannot get better!
Thanks! :)
Excellent explanation
Thank you! :)
you, sir, are a genius at explaining things. Thanks
Wow, thanks!
Thanks for explaining so well. Where were you and your teaching all these years? sad could not find you earlier.
Thanks! :)
The intro tune on this is one of my faves
Yeah! That's a good one! :)
Josh- thank you for the lessons.Quick question- Can you elaborate more on what you said at 9:55 ? "If I pick a pair of random numbers that add up to 100 and use them to calculate log odds and draw a histogram". Can you simulate a few random examples and convert those to make a histogram that is seen in the video? For some reason I cannot completely understand how does log transformation makes a normal curve.
For example, I randomly pick the number 2, then 100-2 = 98. I then calculate log(2/98) and add it to a histogram. Then I randomly pick another number, 73, then 100 - 73 = 27. I then calculate log(73/27) and add it to the histogram. If I do this 100s of times, the histogram will be normally distributed. Thus, log(odds) values are normally distributed.
log odds chad af ngl. Didn't know the normal distribution thing. Nice nice
bam!
Great work all the time.thank you so much
Thank you! :)
this is excellent! thank you sir
Thanks!
This is shockingly clear.
Thanks!
Hi Josh,
Regarding the statement you made at 9:46, about pairs of numbers, do you mean any pairs (a,b), s.t. (such that) a+b=100, a>0, b>0 (duh! :) )and you then take log(a/b) and you plot a histogram of these values for many, many such pairs?
So, is this the Central Limit theorem at play here? If so, then getting a normal distribution makes sense.
But at 10:11, when the problems turn to binary outcomes (win/lose, True/False), do you take the ratio of p/(1-p) , where p = Probability of win | True?
Log(odds) are always calculated with respect to binary outcomes. We simply take the log( # of true / # of false). If we did that with randomly selected numbers such that a + b = true + false and a and b > 0, then we would get a normal distribution of log(odds).
Absolute Legend! I'm officially a BAM subscriber! 🎉
Thank you very much! BAM! :)
This is the best of RUclips
Thank you Josh! Using random 2 dice rolls (like in craps), you describe odds and probabilities. But the outcome has variability over a shorter number of rolls. Is there an equation or some other method to quantify that variable in roll outcome other than experimental measurement? For example, will rolling the 7 have more variability in outcome than rolling the 4? Thanks for helping us enjoy math. David
If you watch the follow up video, Odds Ratios and Log(Odds Ratios) ruclips.net/video/8nm0G-1uJzA/видео.html you'll see ways to estimate the standard error for exactly the problem you are talking about, and, just as you suspect, it depends on the number of times you roll the dice. Watch that video and post a question there if it doesn't make perfect sense.
thank you a lot this video explained what i needed :)
bam!
I love this video, it is clear and get the point inside my brain. BAM!
Btw I want to ask,
1. Do we use ln or log? Log bases e or log bases 10?
2. After put the Log(odds)... is the data distribution become normal distribution?
Thank you Josh
You can use whatever base log you want, as long as your are consistent. However, the traditional base for statistics and machine learning is base 'e', or the natural log.
And the Log(odds) are normally distributed.
Wow mind blowing explanation
Thank you so much 😀
OMG!!! You are just awesome. You make all the top notch university professors ashamed!!
Wow, thank you!