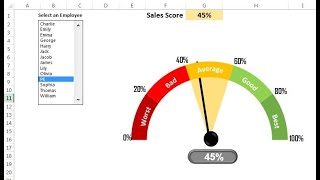
Rating Meter Chart in Excel || Five Performance Buckets || Show Process or Portfolio Health

HTML-код
- Опубликовано: 1 янв 2019
- #RatingMeterChart #PerformanceRatingVisual #PortfolioHealthChart
Hello Friends,
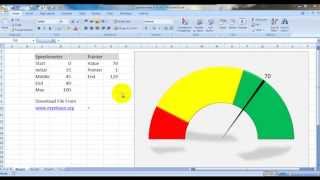
In this video you will learn how to create a beautiful and Innovative Rating meter chart to show the Process or Portfolio level health in five buckets - Worst, Bed, Average, Good and Best.
Please download this excel file from below given link:
www.pk-anexcelexpert.com/rati...
See our Excel Products:
www.pk-anexcelexpert.com/prod...
Visit to learn more:
Chart and Visualizations: www.pk-anexcelexpert.com/cate...
VBA Course: www.pk-anexcelexpert.com/vba/
Download useful Templates: www.pk-anexcelexpert.com/cate...
Dashboards: www.pk-anexcelexpert.com/exce...
Watch the best info-graphics and dynamic charts from below link:
• Dynamic Graphs
Learn and free download best excel Dashboard template:
• Excel Dashboards
Learn Step by Step VBA:
• VBA Tutorial
Website:
www.PK-AnExcelExpert.com
Facebook:
/ pkanexcelexpert
Telegram:
t.me/joinchat/AAAAAE2OnviiEk5...
Twitter:
/ priyendra_kumar
Pinterest:
/ pkanexcelexpert
Send me your queries on telegram:
@PKanExcelExpert


Thank you! I will learn a lot from you! I live with my family in the Republic of Estonia. Lots of peace and joy to you!
Thanks for your valuable feedback
Thanks for the video. It was very helpful. Particularly the level of detail of the steps you walk through and demonstrate.
Top Dez. Obrigado por compartilhar. Continua, vamos aprender muito
Obrigado pelo seu valioso feedback
Excelente, como siempre marcando la diferencia, gracias por compartir el conocimiento.
Gracias por sus valiosos comentarios. Te deseo un año nuevo muy feliz
Feliz año mi buen amigo. Excelente trabajo el que compartes con mucho entusiasmo.!! Un abrazo
Woow amazing, good one, thanks. Real excel expert.
Thanks for your valuable feedback
parabéns Pk, seu canal é Incrível
Obrigado pelo seu valioso feedback. Desejo a você um ano novo muito feliz.
Great learning. Very helpful. Thanks for sharing.
Thanks for your valuable feedback
Splendid, thanks is not enough for the work you do.
Thanks for your valuable feedback
Cannot say how much I appreciate showing us how this was done. I have wanted to do meters in Excel for quite sometime. It is not as easy as one would expect and requires practice. Despite this being ~12 minutes, the video is presented too fast to consume and follow along. I must have stopped and backed up ~50 or more times just to duplicate what was being taught. Easy 30 minute teaching topic in a classroom setting. Again, awesome video!
Yes
I am addicted to this channel. Great learning tool! Thank you for these.
Thanks for your valuable feedback
Amazing videos! It helps me a lot! Thanks!
Thanks for your valuable feedback
Hi, great video, thank you. I only found that you went a bit fast and in some instances I needed to stop and rewind over and over in order to catch what you were doing, with all the stops and rewinds I took almost 3 hours to follow along. It is an awesome tool and I thank you for sharing!
Hola PK... Sorprendente, ya buscando aplicaciones para el. Muchas gracias
Viry Nice. Thank you so much !
Fabulous videos ur making
Thanks for your valuable feedback
Excellent, how sad in Brazil, show de bola, congratulations.
After watching several other video's and failing, this one gave me an easy way to create a beautiful chart. Subscribed and upvoted!
Glad it was helpful!
Salute sir. I have learn new things from your video. I call you a Master and will learn new things forward.. I will share my learning to others to improve themselves .. Thanks.
Keep learning..
Thanks for your valuable feedback and support to my channel
*Very very excellentl sir . Very very helpful*
Thanks for your valuable feedback
Brilliant Sir! The pie chart within the doughnut was too good 👌👌👌🙏🙏🙏
Thanks a ton
Our genius Professor..... Very interesting topic!... I tried to copy your style and my Supervisors were very amazed wt my presentation.... I gained their respect.... Lot of thanks..... GOD BLESS.... and more brain power to you...
Thanks for your valuable feedback
awesome, thanks for sharing it.
Excellent Video. Thank you very much
Glad you enjoyed it!
Great. Thank you so much
Thanks for your valuable feedback
Many thanks.
Very nice..keep up the good work
Thanks for your valuable feedback
Beautiful use of Excel. Please make one on powerpoint as well and share
You help me a lot dude tnks!!!!!!!!
Thanks for your appreciation. Request you to please share this with your friends and colleagues.
Good One.....Great start for 2019 👍👍
Thanks for your valuable feedback
Excellent presentation Si8r
Thanks for your valuable feedback
Happy new year PK, nice start for new year
Happy new year Santosh. Thanks for your valuable support.
Awesome. Thank You!!
You're welcome!
This is awesome interactive and creative chart 😀
Thanks for your valuable feedback🙏
great sirji!
Thanks for your valuable feedback
Amazing.. admire about your knowledge in excel :) :) Keep it up
Thanks for your valuable feedback
Thanks Awesome!
Thanks for your valuable feedback
Thank You So Much for Your Sharing.
Most welcome
That is awesome
Thanks for your valuable feedback
Awesone sirjee
Thanks for your valuable feedback
Great Job
Thanks for your valuable feedback
Thanks sirji
Thanks for your valuable feedback
awesome video PK!!!
Thanks for your valuable feedback
An amazing
Thanks for your valuable feedback. Please share this with your friends and colleagues.
Excellent. Can data from multiple excel inputs from different users reflect on this spedometer in real time or do you create one specially for each user?
I like your original intro. :)
I'm glad you like it
Hello Kumar,
Its like a gauge meter, very nice
Thanks for your valuable feedback
great video
Thanks for your valuable feedback
Too good boss
Thanks for your valuable feedback
U r brilliant bhai ... Too good
Thanks
Thanku sir very much
Most Welcome
Kia bat hi sir very very nice this video
Thanks for your valuable feedback🙏
Great sir ji. Can you also help me for automatic email from excel thru lotus notes.
amazing
Thanks for your valuable feedback
Great sir
Thanks
Waw top
Thanks for your valuable feedback
Hello, question: If you want to use the result from a Pivot Table instead enter the percentage manually.. how can you do this change?
Great
Thanks for your valuable feedback
thank's, very useful, is it possible to get the file ?
Gr8 pk
Thanks for your valuable feedback
Mast ever
Thanks for your valuable feedback
Hie sir.. Youre videos are really helpful... If you could help me understand how i can make automat a letter using excel macros.. Example: there is a template given at a location i need excel to go there and fill the empty fills or required fills and create a letter.. Please assist
Sir unable to find the excel link to download..Kindly share it on my comment box.. Appreciate your help
This is great..but please slow down a little. Thanks!
Thanks for your valuable feedback. I will take care of this in upcoming videos
gracias amigo de dónde eres u como te llamas excelente videos , fantásticos saludos 🤝👏👏👏
Gracias por sus valiosos comentarios. Mi nombre es PK y soy de la India.
How can we group all elements of speedometer if I want to shift/show in other sheet? I tried to show in other sheet but the black rim and the imoticon did not appear.
top
Thanks🙏
Hello PK, I love your videos, and may I ask you to prepare speedometer or rating meter chart with the target and values not percentage?
Thanks for your valuable feedback. I will definitely try to make such video.
That’s fantastic. How would you handle values that are less than zero? I’d like these to be counted as worst, but not sure how to effect this in the dial?
I will try to make a separate video for this
You could try to add to your formula a max formula and adjusted so when the numbers are less than zero, it bumps it up to 0. That way your graph or table will look more professional.
Great video. In Cell E4, what is the logic of putting in the 200% formula? I am trying to do this with $ amounts rather than %, and this step is proving difficult. Thanks!
The range of percentages is 1-100, so using 200and subtracting from that creates a half circle range for the arrow. If you want to be able to input a range up to 25 (for instance, you would replace 200 with 50.
All I have to say is great job teaching us but when moving the mouse and showing us what to do you have to slow it down so we can catch on. Display the mouse on to the area so we can see it also not only communicate it. Voice was a little hard to understand sometime my friend. Other than that awesome!!! I do thank you and continue to show us the way. Now, Back to class hahahahah.
Thanks for your valuable feedback
All the Kumars are smart :)
Thanks for your valuable feedback
Sir, can excel automatically allocate the cases to employees in excel, if I paste data that automatically should be signed
Assigned
Hello PK Ji, after creation of half donut chart I want to use it on top of my Excel data but as the chart area is full I want to use only top part of chart and below hided chart want to hide below the data is it possible? Please help and support. Thanks
the smile still has a border of it even when i try to make it no outline it is still visible , help please
this is such a clever technique - but I had to pause and re-watch constantly to spot his cursor movement's...
Masterstroke
Thanks for your valuable feedback
I love these Speedo charts but I’m stuck, I have a max range of 5 and the data I want to present is .01 through 5, so my data can be 2.57 for example, how can I do this?
How can we move all the chart once score meter is prepare
I am not able move all the chart at a time - group function
this chart starts from 20% what if I want to start with 0% and whatever percent i type the needle should go there instead of defined 20, 50 75, 95
Just change the angle
May I know what is the excel version you are demonstrating? It seems that my excel version does not have some of the functions.
What if we want it “bad” if it goes over 100%?
Wheres the code for visual basic?
Hong Kong's luanita yes to affirmyes American
fucking cool!!!!
Sir why we have used 200%
Делай стрелку из границы, а не как отдельный сектор
It's great , but clearity is not good ..to recon
Amazing but u r too fastt
Thanks for your valuable feedback. I will take care of this in upcoming videos
Your speaking pace is too fast to catch.
Thanks for your valuable feedback. I will take care of this in upcoming videos
You are too stupid to catch. You have a choice to pause his video and follow his steps.
Seems you are too busy to reply, why are you feeling offended. I posted my view on your video. If you are not ready to take feedback than I am sorry you should opt out For feedback. Feedbacks could be positive or negative it depends upon the viewer perception. In this video you are just pacing that the drawback.
Ohhh, I was unaware of this that there is option to pause. LOL.
But you are not explaining the reason for anything. This is not teaching. Sorry!