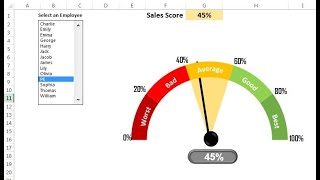
Info-graphics: 3D Gauge Chart in Excel
HTML-код
- Опубликовано: 29 мар 2020
- #Infographics #ExcelCharts
Hello Friends,
In this video, you will learn how to create beautiful 3D Gauge Chart. We have used Excel shapes and Pie Chart to create this beautiful visualization. You can use this chart in your business dashboard or presentation.
Please download the practice file from below given link:
www.pk-anexcelexpert.com/3d-g...
Download our free Excel utility Tool and improve your productivity:
www.pk-anexcelexpert.com/prod...
See our Excel Products:
www.pk-anexcelexpert.com/prod...
Visit to learn more:
Chart and Visualizations: www.pk-anexcelexpert.com/cate...
VBA Course: www.pk-anexcelexpert.com/vba/
Download useful Templates: www.pk-anexcelexpert.com/cate...
Dashboards: www.pk-anexcelexpert.com/exce...
Watch the best info-graphics and dynamic charts from below link:
• Dynamic Graphs
Learn and free download best excel Dashboard template:
• Excel Dashboards
Learn Step by Step VBA:
• VBA Tutorial
Website:
WWW.PK-AnExcelExpert.com
Facebook:
/ pkanexcelexpert
Telegram:
t.me/joinchat/AAAAAE2OnviiEk5...
Pinterest:
/ pkanexcelexpert
************ Suggested Books ********
VBA: amzn.to/2TMMikX
Excel Dashboard: amzn.to/2WZi2Fj
Power Query: amzn.to/2Ibd7xR
Power Pivot and Power BI: amzn.to/2DCg8BB
Exam Ref 70-778 (Power BI): amzn.to/2GnWYTN
************ My Stuff ***************
Mic : amzn.to/2TLnF88
Video Editor: screencast-o-matic.com/refer/...
I am a Financial Modelling practitioner. Your excel info-graphics tutorials are amazing. I really thank you for significantly impacting my skill set. Thank you so much PK.
Thanks for your valuable feedback
PK, you are probably the best info-graphics coach on RUclips. Thank you.
Thanks for your valuable feedback
Unbelievable! The most beautiful visualisations, made available to all of us! Thanks PK.
Aplausos desde Chile. An amazing gauge chart. Stay safe, stay at home. Greetings fron Chile. Thank you for sharing your knowledege.
Thanks for your valuable feedback
Eres lo máximo no pensé que se podía realizar estas cosas en Excel . Thank to share this material.
This is beautiful. PK is another grade of expert
Thanks🙏
i appreciate your efforts and the valuable lessons and tutorials , all amazing.
Your work shows how Science and Art can go hand-in-hand to run business 😄 Commendable work once again!
Thanks for your valuable feedback🙏
Hats off!!! You are an artist. The Excel Michelangelo
Thanks for your valuable feedback
I hope the king of excel is healthy and safe 4m this on going pandemic.
Hi Santosh, I am fit and fine. Thanks and take care
Amazing. Thank you for clear explanation. I am learning alot from you. Keep up the good work and once thanks again. I have never thought I would be able to do these things. I am using them for my presentation
Thank you so much for such clear and specific explanation. Thanks again.
Thanks for your valuable feedback
Wow...... another interesting topic for the day.... Thank you you again, Sir....
My pleasure
Thank you your hard effort to create excellent gauge chart. I have to learn your level of completion.
Thanks
The best ever Innovative chart creation I have ever seen.. Great word Done..
Thanks for your valuable feedback
I love your gauges! Thank you. If you could only make them animated i.e. let the needle move to its destination automatically when workbook open. This will make the attachment/chart perfect!!!
Thanks for the tip! I have created few animated chart videos also. I hope will love this videos-
ruclips.net/video/0loAZFw10JU/видео.html
This is awesome PK. Keep em coming. Thank you and stay safe.
Thanks for your valuable feedback
Amazing... 100 times Worth to watch 👍
Thanks for your valuable feedback
I love this guy, thank you for the tutorial Sir.
Thanks for your valuable feedback
Sooo beautiful boss.. I really like the easy way you explained the module.. Thanks master 👍🌹❤️
You are most welcome
thank you very much
You are welcome
Top! You are the best. Tanks for sharing
Thanks for your valuable feedback
Your teaching of excel is really lovely and impacting. Please I want you to produce a video that will teach how to prepare school time table that will be high flexible.
With the following features:
1. A teacher possibly taking more than 1 subject.
2. A class possibly having 2 subjects at the same periods.
3. Each subject having its own no of periods per week.
4. Possibility of science subjects in science laboratory, with consideration that two/three classes may be sharing the same laboratory.
And other possible features.
I will appreciate it if you can work on it. Thanks.
Excellent. You imagination is really wild. Keep it up.
Thanks for your valuable feedback
ขอบคุณมากครับ
Most welcome🙏
Muito obrigada por me ensinar
Babut bhadiya. In first video only i subscribed. Keep it up
Thanks for your valuable feedback
Very Impressive and Creative Master Kumar. I love the way you work. Keep Safe and be Bless!
Thanks for your valuable feedback
جميل جدا...عمل رائع
Thanks, good work again!
Thanks for your valuable feedback
Bahut pyara
💕
Thanks
Awesome sir....as usual attractive visuals👌👌
Thanks a ton
this is wholesome bro
Dabang Guru ji
Thanks for your valuable feedback
Thank you very much
Excellent 👌 pk
thanks
very useful for me
thank about your sample file
very very thanks
Thanks for your valuable feedback
Superb presentation
Thanks for your valuable feedback
Great Job Bro !!.. Keep up the good work... this
Thanks for your valuable feedback🙏
I really appreciate the way you teach excel tricks. Please I will want you to produce a video on fully automated school register having the following features.
1. Attendance is taken twice daily
2. Holidays are conditionally formated.
3. Total daily attendance for each of the sexes is recorded.
4. Weekly attendance is calculated.
5. Weekly percentage attendance is determined.
6. Termly attendance is calculated.
I will appreciate if you can produce a tutorial on this. Thanks.
the best!
Thanks for your valuable feedback
Excelent !!!!
Thanks
Super......excellent work
Thanks for your valuable feedback
Nice to see sir
Thanks for your valuable feedback
مرسی
Good video....!!!
veeeeeery nice good work keep it up
Thanks a lot
Good stuff again PK
Thanks for your valuable feedback
Brilliant.. please suggest me some videos on productivity dashboard
Thanks sir
Thanks for watching
How do you make 0 in the center and negative numbers on one side and positive on the other? Love your videos.
Harika bir ders
Değerli geri bildiriminiz için teşekkürler
Very very good
Thanks for your valuable feedback
Nice One Sir,
#sjtechbharat
Thanks for your valuable feedback
Many thanks sir, could you make video where we can put negative number in speedometer
Sure, I will definitely try to make such video
[All is completed from beginning till the end. Safe_$]
Thanks
Hi bro.. I first comment
Super! Thanks a lot
Amazing Tutorials, Can the Excel Work Sheets be shared?
In the description
Hi PK. You are awesome. Well you came from which planet :) :) ?
Thanks for your valuable feedback
Instead of a fixed colour on shapes. Is they no way the colour can change conditionally on the shapes depending on for example performance achieved?
Yes can do. I will definitely try to make such video very soon
Where we will get angle option in 2007version
Please I want userform for count after filter or only code ❤❤❤
I will try to upload