How to plot FTIR data in origin Pro || Baseline correction || find Peak || labeling of peaks

HTML-код
- Опубликовано: 7 фев 2025
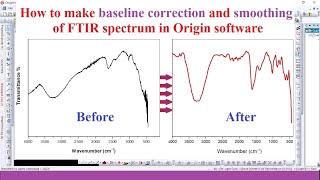
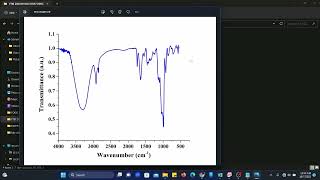
- This video will explain how to pot FTIR graph in Origin Pro, How to improve its quality by doing base line correction and finally how to find peak and label them


![I.N "HALLUCINATION" | [Stray Kids : SKZ-PLAYER]](http://i.ytimg.com/vi/n5B5q1Hwt_U/mqdefault.jpg)

this helps me clearly how I should draw my FTIR thesis keep doing it
Thank you so much sir.. It was very helpful in plotting graph.. You provide information in very better way.
Thank you, SIR... I failed to do FTIR analysis for 2 months in 2022. Your video is very helpful. Sir, It will be grateful , if you can also teach PCA analysis on Case- Control FTIR data.
Yea sure, I ll try to make video on those topic as well. Thank you for your suggestion.
Yours is simply the best. Thank you so much
Thank you for this wonderful explanation.
Thank you for your valuable presentation..Really it helped me a lot..keep up the good work
Nice presentation of IR smoothing on Origin
Thank you sir for your appreciation!
this Video made my day.......Thank u Sir
Thank you for the nice explanation..keep it up
thank u sir, it was very helpful :)
Thank you so much sir
Hello sir can you please tell me that, why it is necessary to set base line , as graph can polt without it also, so why base line correction is must??
Thank you for the content.. What are the criteria for baseline?
Thank you NAno.
I will request you go through the following paper for more clarification:
1. Baseline correction for infrared spectra using adaptive smoothness parameter penalized least squares method.
2. Study on baseline correction methods for the
Fourier transform infrared spectra with
different signal-to-noise ratios.
Sir how to click points for base line correction. Can we randomly select some points?
@@manjupriya6574 yes you can do, there is another video on baseline correction you may watch that
Such a helpful content 👍
Thank you so much Dr Mani. I would like to know how to calculate absorbance of each peaks?
Nice content Mani ❤
is it compulsory to plot the ftir in transmittance form? can we plot in absorbance form and what is the difference between the two
The primary distinction between the two is that absorbance quantifies how much light is absorbed by a substance, whereas transmittance measures how much light flows through a substance. Because transmittance and absorbance are not complimentary values, adding transmittance to absorbance alone does not yield the total incident light.
It is not compulsory to plot the FTIR in transmittance form. It is possible to plot it in absorbance form as well.
However, the choice of whether to plot in transmittance or absorbance form depends on the specific application and the type of data being analyzed.
Can you explain for XPS as well?
Could I ask how to calculate the area of each band? Thank you so much, Sir.
You watch this video, you will get all idea about calculating area under any band:
ruclips.net/video/ESDOMJ5HUAI/видео.htmlsi=kaE-M5RlpwtzYa0B
@@LearnwithDr_Mani thank you so much for your kind help, Sir.
Good afternoon sir. If increase doping different concentration OH band decrease..... Any specific reason.. kindly help me sir
Thank u sir
Please do make a video of plotting XRD graph brother.
Coming soon
Sir , is it compulsory to do baseline correction?
Not required
Sir why baseline is drawn above the graph?
I think it's a transmittance graph, that's why the bass line is drawn above
Sir how to measure intensity from the transmittance data
Sir can you please guide me how to quantify peaks of FTIR manually using ominic software.
I have no idea about Ominic software, but I'll look into it.
thanks for the video. I have a question, if I smooth the data to much it will change my analysis? I mean, if my sample has to many peaks highs and lows, very close to which each other, then when I smooth, it becomes just a simple curve.. I hope u know what Im trying to say haha. Is that ok then? Thanks again
Yes, it will affect your data and result when this ups and downs will at any particular peak. You can retain these peaks in graph by increasing polynomial order.
Where these various peaks are at any slope and does not have intensity then you can eliminate them. I hope this might have cleared your doubts.
@@LearnwithDr_Mani Oh I see. So is better for me eliminate only the peaks that doesnt affect my sample. Ok. Thank you
Absolutely correct!
Good video. How do you remove the 0 before the number ?
write "#4" in Numeric Display Format
nice
And sir you didn't tell how to put this graph in the thesis
Sir ye red line to remove ni ho rhii
Share your problem here:
t.me/+ZJrCe-b8LnM1ZWE1
how to remove the gridlines in my FTIR data results?
Go to view---> Show ---> untick layer grid and page grid
But transmittance to negative main aa gya na
Yes, you are right. It is a limitation of doing baseline correction, but this won't affect your result. Anyway, you will not quantify your function group, so you don't need the amount of absorbance for a particular functional group. So, you can remove (don't show) the y-axis data for better representation.
Please add about PL
Sorry air i am a beginner but i didn't understand how you start the data because i received the result email so how to take data from the email and how to put it here you didn't say anything about it 😭😭😭
Hello dear,
Check your mail and see in which format your data is (like, xlxs, txt,...) and search in RUclips how to import those data into origin. These are very basic, thats why I have not covered in this video.
@@LearnwithDr_Mani thanks for your reply but now i plot my FTIR graph
What is FT? IR is infrared
FT = Fourier-transform
Is there any free app for FTIR analysis sir?
You shall learn to speak faster.
Can u share your mail id or contact number.i want to do baseline correction and sm unable to do it .can u correct it..will pay for it..i have 7 datas
Join this and DM me
t.me/+ZJrCe-b8LnM1ZWE1
Thank you sir