Best explanation I’ve seen so far!!! Can’t believe im watching this for free!!! This one’s definitely better than Physeo’s or BnB’s explanation!!! Keep it up!!!
After listening some hundreds of lectures about venous return I came to know that this was the really good and amazing lecture that this gives me clarification. And want more lectures like this....
Sadness is such golden videos being suggested after almost a year of step-1. This is an amazing channel, I am done with step-1 yet I am binge watching the videos on this channel. Great stuff.
Genuinely the best video. Love my lecturers but I was so lost and double guessing myself and you explained everything so nicely that I am now excited about this topic. Thank you so very very much!
You saved me bro Thanks a lot i am studying for step 1 and exam in about 3 months started doing these curves and i was very confused but your video really helped Thanks a lot for helping loads of Drs May Allah bless you Greetings and thanks from UK
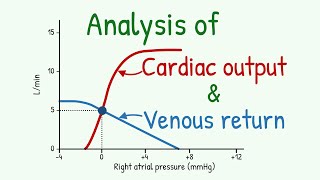
Hi ! I'm an Italian student, sorry for my English. I know that pressure in peripheral veins is about 7mmHg and the pressure in right atrium is, physiologically, near 2mmHg. So the Delta P, responsible of venous return, is about 5mmHg. I also know that the right atrial pressure that blocks the VR is 7mmHg, in fact: DeltaP= 7-7=0 When we have a decrease in TPR, we have an increased VR. Doesn't this increase mean as an increase of the Q variable in Poseuille Law ? The poseuille law is: Q=DeltaP/R. If Q increases, we will see an increase in Delta P (if the R remains the same). Shouldn't this increase of Delta P also increase the pressure in right atrium which can block the venous return ? For example: if 7mmHg in peripheral veins turns into 10mmHg, shouldn't the right atrial pressure that block the venous return be 10mmHg ? So why all the blue lines in the graph (13:23) start at the same point ? Thank you so much I hope you can understand what I said
Very well presented. You must have spent a considerable amount of time to put it all together. Thank you! However, I would appreciate it if you could clarify one nagging question. At 14:25, increasing TPR or decreasing TPR leads to an increase or decrease in CO at the same RAP and MSP. That means the driving pressure is the same but outcome is opposite. How do you explain an increase in CO or a decrease in CO at the same driving pressure (MSP-RAP)? Thanks in advance.
This is because on increasing TPR, afterload increases and CO also decreases. So, TPR causes both factors to change which wasn't the case in the first two cases.
@@Shantanu.Shandilya So, it is just the volume effect (dilation or constriction); same driving pressure but more flow vs less flow effect. Would it be correct to put it this way? Thanks.
Why can't we just determine the MAP from the curve? instead of using the formula (at 6:29) Because MAP is the RAP where the VR curve equals zero right?
That would be mean systemic pressure (aka mean systemic filling pressure) not mean Arterial Pressure. I don't think if we can determine map directly from these curves
Hi! I have a question regarding the resistance, I don't understand why an increase in resistance would not cause a decrease in mean systemic filling pressure. If resistance is increased in the arterioles, that means that the amount of blood per min getting to the venous side of circulation would decrease right? You explained that this would decrease compliance of the veins so MSFP is maintained, but why would this then not work for, let's say the kidneys reabsorbed more water causing the blood volume to go up, then the veins could also increase their compliance right and maintain the same MSFP. or the opposite, you lose a lot of blood, so the veins then decrease compliance, and the MSFP is maintained.
Smart questions! 1. In case of blood loss, the veins do decrease their compliance (get constricted) to push their blood into the arterial side (to be used for perfusion). 2. The kidneys and all the other hemodynamic systems do come into play in maintaining a balanced hemodynamic control, but we are not including all those in this discussion because it will get super complicated to understand. I hope this makes sense.
Hello, thank you for your clear explanation. I just didn't catch why the MSP doesn't change when the TPR increase or decrease. Can you help me with that please?
brilliant explanation a question, at 7:49 : CO has increased due to increased inotropy and the curve is shifted upward... working point of heart is changed.. but u use the same RAP for the increased CO.. wouldn't the RAP be changed acc. to the new shifted working point?
I just drew RAP for the normal curve. When the curve is shifted up (and you plot rap) you can see that rap has moved to left meaning it actually DECREASES with increased contractility (more blood going out, lesser staying in right atrium => pressure goes down). The opposite is true for decreasing CO. I hope it makes sense now. You can try plotting RAP on First Aid or Kaplan, my diagram is kinda messy
We know that fluid overload should not be given to pts with cardiac failure... However if we use these graphs to find the results of fuid overload on pts with decreased cardiac function it seems that there is not that much of a difference in the cardiac output. Also i dont under why in some starling curves of heart failure there is a plateau while in others there is a downward depression of cardiac function towards the end. I mean if we were to use the curve with downward depression with these vascular curves it would all make perfect sense for fluid overload in heart failure.
Thank you so much for the video. I have a question about TPR and venous return. If we constrict the arterioles, why does VR drop? It takes slower due to resistance but the volume shouldn't change right?
You are right. Slow speed means less blood per minute pouring into the heart. So reduced venous return per minute. However total volume of blood in the system (body) remains the same!
GRAB the MD thank you so much!! The way you explained everything makes so much sense. May I also ask why does Right Atrial pressure drop with increased contractility?
@@raspberry765 let's have a thought experiment. Let's see we REDUCE contractility, blood will start backing up in the heart chambers including the right atrium which will INCREASE RAP. Now think what will happen if we INCREASE contractility. Means the heart is pumping out most of the blood, the atria including RA will be empty most of the times hence the RAP goes down. I believe there's a more sophisticated explanation but this is how I think about it
What is the cause of the knee (flat portion) on the vascular function curve ? And if it’s because the veins collapse at negative right atrial pressure wouldn’t that render the venous return zero instead of a value near 7 liters/min ?
Good question. Let's set some ground rules. 1. There are no negative values on this graph. Both the axes start from zero. 2. The top flat portion (knee) on the vascular cure is the maximum amount of blood that can flow from veins into the right atrium. If you can trace from this flat portion vertically down, you will see that right atrial pressures are pretty low (but not below zero). At low right atrial pressure, the veins are pouring maximum of their blood into the right atrium. This portion is flat because venous return can't get higher than this physiologically. As we move to increasing right atrial pressures (towards right on x-axis), the RAP approaches MSF and the venous return keeps decreasing as shown by the downwards trend on vascular curve (starting at the end of the knee). Hope this helps!
You said after increasing TPR blood flows slowly to vein and blood flow decreases to right atrium. So why the msp doesn’t go down? By the way I really liked your explanation. .
When the veins receive reduced blood, their compliance goes down. That results in increased pressure (P=V/C). This increasing pressure brings the msp back to normal. Hope this helps. Remember blood shift to arterial side reduces venous compliance. Blood shift to venous side increases venous compliance. These changes in compliance keep the msp in check. So the only way to change msp is either lose blood from the system. Or make vein constricted or relaxed.
Why does an increase in venous tone cause an increase in venous return (veins--> right atrium), but constricting the arterioles causes a decrease in blood flow from arteries to veins. It doesn't make sense to me that constriction has different effects in these 2 situations. Thanks in advance
In real life, veins are constricted by muscles but not all the veins are constricted simultaneously. So let's say the calf muscles constrict the veins in the legs but those in the upper body are still relaxed. So the blood goes from the legs towards the upper body and the right atrium eventually. Hope that makes sense
Thank you so much for the video! I have a question though, how does TPR not affect the mean systemic pressure/right atrial pressure? the venous return is increased, meaning that the blood volume to the heart is increased, so why does the RAP remain the same?
If you read the last sentence in First Aid under this section, it says in real life it's a mix of things. Everything can change everything. But for Step 1 we should stick to some rules. So unless you put more blood into the circulation, msp won't change. That's how I used to think when answering the questions.
Vasodilation and vasoconstriction in this context is related to arteries. MSP is related to venous system that's why it's not altered by Vasodilation and vasoconstriction of arteries. Hope that helps
RAP follows the x-axis. If we move right on the x-axis, the RAP increases. Now look at what happens to the VR curve (blue) as we move right on the x-axis. It comes down (decreases). Hope that helps ✌️
@@ritvikahada9827 alright I see what's causing the confusion. In this case I am putting more blood into the RA which will stretch the RA and increase it's pressure. But at the same time I am keeping the cardiac output higher than normal, so whatever comes into the RA, gets out of it, and it does not exert backwards pressure on the veins to reduce the VR. If I keep the CO at normal and increase the VR, the RA pressure will go up but this time it will exert back pressure on venous return to decrease it. I wish I could explain it better
I dont understand how this stament is true: An increased blood volume (or venous tone) causes the cardiac output to increase and right atrial pressure to increase if the graph doesn't show increase in CO could someone help how to see increase of CO in the graph when venous return is changed?
can someone explain if the cardiac output changes with changes in the blood volume(second graph)? it should decrease with a decrease in blood volume or venous tone,right?
When we stop the heart. It could be done experimentally in lab animals. It's also observed during ventricular fibrillation when the heart is not being able to pump any blood (and could be considered a non-beating heart)
If I remember correctly, septic shock gives a High Output Cardiac failure (not low CO). The main problem is vasoldilation which leads to very low tpr which causes poor perfusion of end organs. So to increase tpr, we give them vasopressors. I hope I am not wrong
You are the Legeng bro❤️:;; but plz clear one question that why increase or decrease in the Cardiac output has no effect on MSP (as change in CO has effect on venous return too) plz clear it 😭🙏
MSFP represents the pressure generated by elastic recoil in the systemic circulation during a no-flow state. When we bring cardiac output to the discussion, it means we are not talking about a no-flow state anymore. MSP depends upon the elastic recoil of veins (put more blood into the veins from outside => veins will stretch out more => veins will recoil back with force => increase MSP). Hope this makes sense


Best explanation I’ve seen so far!!! Can’t believe im watching this for free!!! This one’s definitely better than Physeo’s or BnB’s explanation!!! Keep it up!!!
agree completely
agree
exactly after 31 mis of physeo and 16 mins of b and b i was still confused but he finally made this concept clear for me
agree 👍🏼
After listening some hundreds of lectures about venous return I came to know that this was the really good and amazing lecture that this gives me clarification.
And want more lectures like this....
Good to know it's helping 😊
I just can't believe tht cardiac output and venous return curves can be this easy !!
May God bless u !!!
This video is more than just brilliant!!!!!
Wow, I've never understood this graph and tried so many videos to understand it, but this video made it obvious in less than 5 minutes. Thank you
Sadness is such golden videos being suggested after almost a year of step-1. This is an amazing channel, I am done with step-1 yet I am binge watching the videos on this channel. Great stuff.
Thank you. That's high appreciation. This comment goes to the top!
Genuinely the best video. Love my lecturers but I was so lost and double guessing myself and you explained everything so nicely that I am now excited about this topic. Thank you so very very much!
You saved me bro Thanks a lot
i am studying for step 1 and exam in about 3 months started doing these curves and i was very confused but your video really helped
Thanks a lot for helping loads of Drs
May Allah bless you
Greetings and thanks from UK
Thank you Tayyab for such kind words. These really mean a lot
4 minutes into the video, and already gained a subscriber, really thank you !
Wow. That's deep physiology made easy. Thank you, Grab the MD, for taking the time to make these videos.
This is by far the best explanation I've ever came across. This is ideal platform to nurture future cardiologists and cardiothoracic surgeons.
Don't forget anaesthetists!
After watching many videos of kaplan I finally understand CO/VR thank you❤
With this video, you've got yourself a new sub. It was electric
The best video to exist on this topic .
Thanks a lot for this
Got what i was looking for in under 3min in your video, thank you for making this easy for me
Great explanation
You deserve 30000000 subs! thank you!
Extremely helpful video for medical school
Best explanation on RUclips
best of the best, I was looking for answer to my question and found it here. Great job. Keep it up!!!
Amazing .. i watched several videos regarding this topic.. this is the best 👍🏽
Great video with crystal clear explanations, thank you
Absolutely amazing video!!! Compliments and much appreciated
Best explanation of this topic I've found! Thank you so much for this, it's really helpful :)
Hi ! I'm an Italian student, sorry for my English. I know that pressure in peripheral veins is about 7mmHg and the pressure in right atrium is, physiologically, near 2mmHg. So the Delta P, responsible of venous return, is about 5mmHg.
I also know that the right atrial pressure that blocks the VR is 7mmHg, in fact: DeltaP= 7-7=0
When we have a decrease in TPR, we have an increased VR. Doesn't this increase mean as an increase of the Q variable in Poseuille Law ? The poseuille law is: Q=DeltaP/R.
If Q increases, we will see an increase in Delta P (if the R remains the same). Shouldn't this increase of Delta P also increase the pressure in right atrium which can block the venous return ?
For example: if 7mmHg in peripheral veins turns into 10mmHg, shouldn't the right atrial pressure that block the venous return be 10mmHg ?
So why all the blue lines in the graph (13:23) start at the same point ?
Thank you so much
I hope you can understand what I said
Thanks for such a detailed and comprehensive explanation...
you're a lifesaver sir thank you so much
better than BnB explanation for sure.
Brilliant illustration 🎉👍🏻 more videos please!!
This video is a jackpot man!
what a explanation you got blessing and new subscriber added
This was easily understandable. Thank you
WOW! ON POINT! THANK YOUU SO MUCH!!! Please do more CV physiology!
You sir are brilliant and I thank you for sharing your knowledge
Amazing lecture sir, thanks for lectures. Want more and more lectures.
Really superb explanation.. thanks a lot for uploading this
As others have already said, excellent explanation. Hope you can post more videos and all is well.
Amazing lecture thanks. Plz continues this amazing lectures
tat was really simple and understndable ...thks a lot and luking for more videos like tis..
Absolutely amazing, liked and subscribed 💯
Thank you so much for this video it helped to make things easier and clearer thank you
Incredible explanation, thank you!
This was soooo helpful omg!! Thank you so much!
Very well presented. You must have spent a considerable amount of time to put it all together. Thank you! However, I would appreciate it if you could clarify one nagging question. At 14:25, increasing TPR or decreasing TPR leads to an increase or decrease in CO at the same RAP and MSP. That means the driving pressure is the same but outcome is opposite. How do you explain an increase in CO or a decrease in CO at the same driving pressure (MSP-RAP)? Thanks in advance.
This is because on increasing TPR, afterload increases and CO also decreases. So, TPR causes both factors to change which wasn't the case in the first two cases.
@@Shantanu.Shandilya So, it is just the volume effect (dilation or constriction); same driving pressure but more flow vs less flow effect. Would it be correct to put it this way? Thanks.
This was so helpful! Thank you!!!
I finally understand it! Thank you very much :)
this is an excellent video. Thank you so much!
Simply amazing! Thanks a lot!
Thank you very much
These curves were nightmare for me 😂
Excellent Explanation ❤
You are the best.....👍👍👍👍👍👍
very clear video, easy to follow with First Aid open to annotate :)
wish i had such a professor🥺
Such an amazing explanation thanks 😊 alot
Why can't we just determine the MAP from the curve? instead of using the formula (at 6:29)
Because MAP is the RAP where the VR curve equals zero right?
That would be mean systemic pressure (aka mean systemic filling pressure) not mean Arterial Pressure. I don't think if we can determine map directly from these curves
@@GRABtheMD ohh right, thanks!!
Great video, very well explained. Make more videos if you can its helpful, Thanks!
Hi! I have a question regarding the resistance, I don't understand why an increase in resistance would not cause a decrease in mean systemic filling pressure. If resistance is increased in the arterioles, that means that the amount of blood per min getting to the venous side of circulation would decrease right? You explained that this would decrease compliance of the veins so MSFP is maintained, but why would this then not work for, let's say the kidneys reabsorbed more water causing the blood volume to go up, then the veins could also increase their compliance right and maintain the same MSFP. or the opposite, you lose a lot of blood, so the veins then decrease compliance, and the MSFP is maintained.
Smart questions!
1. In case of blood loss, the veins do decrease their compliance (get constricted) to push their blood into the arterial side (to be used for perfusion).
2. The kidneys and all the other hemodynamic systems do come into play in maintaining a balanced hemodynamic control, but we are not including all those in this discussion because it will get super complicated to understand.
I hope this makes sense.
Hello, thank you for your clear explanation. I just didn't catch why the MSP doesn't change when the TPR increase or decrease. Can you help me with that please?
brilliant explanation
a question, at 7:49 :
CO has increased due to increased inotropy and the curve is shifted upward... working point of heart is changed.. but u use the same RAP for the increased CO.. wouldn't the RAP be changed acc. to the new shifted working point?
I just drew RAP for the normal curve. When the curve is shifted up (and you plot rap) you can see that rap has moved to left meaning it actually DECREASES with increased contractility (more blood going out, lesser staying in right atrium => pressure goes down). The opposite is true for decreasing CO. I hope it makes sense now. You can try plotting RAP on First Aid or Kaplan, my diagram is kinda messy
GRAB the MD no bro the diagrams are great. Thanks for the explanation .. means alot :)
Outstanding teacher
We know that fluid overload should not be given to pts with cardiac failure... However if we use these graphs to find the results of fuid overload on pts with decreased cardiac function it seems that there is not that much of a difference in the cardiac output. Also i dont under why in some starling curves of heart failure there is a plateau while in others there is a downward depression of cardiac function towards the end. I mean if we were to use the curve with downward depression with these vascular curves it would all make perfect sense for fluid overload in heart failure.
Thank u sooo much for this awesome video
Thank you for the great explanation!
This video is amazing!!! looking forward to more content for anesthesia school
I am glad to know you liked it. There's definitely more to come 👍
This is GOLD !
It's amazing. Rest of the systems please?
Excellent work brother
Hey, i dont understand why cardiac output first increases when right atrium pressure increases. Can you help me out
Can you please elaborate on your question so I may explain it better
Absolutely brilliant
Well done bro🏃🏼 keep it up
GREAT VIDEO!
Thank you so much for the video. I have a question about TPR and venous return. If we constrict the arterioles, why does VR drop? It takes slower due to resistance but the volume shouldn't change right?
You are right. Slow speed means less blood per minute pouring into the heart. So reduced venous return per minute. However total volume of blood in the system (body) remains the same!
GRAB the MD thank you so much!! The way you explained everything makes so much sense. May I also ask why does Right Atrial pressure drop with increased contractility?
@@raspberry765 let's have a thought experiment. Let's see we REDUCE contractility, blood will start backing up in the heart chambers including the right atrium which will INCREASE RAP. Now think what will happen if we INCREASE contractility. Means the heart is pumping out most of the blood, the atria including RA will be empty most of the times hence the RAP goes down. I believe there's a more sophisticated explanation but this is how I think about it
GRAB the MD bless your soul! Thank you so much, that clicked! And thank you for replying!
Great effort
incredible video
What is the cause of the knee (flat portion) on the vascular function curve ? And if it’s because the veins collapse at negative right atrial pressure wouldn’t that render the venous return zero instead of a value near 7 liters/min ?
Good question. Let's set some ground rules.
1. There are no negative values on this graph. Both the axes start from zero.
2. The top flat portion (knee) on the vascular cure is the maximum amount of blood that can flow from veins into the right atrium.
If you can trace from this flat portion vertically down, you will see that right atrial pressures are pretty low (but not below zero). At low right atrial pressure, the veins are pouring maximum of their blood into the right atrium. This portion is flat because venous return can't get higher than this physiologically. As we move to increasing right atrial pressures (towards right on x-axis), the RAP approaches MSF and the venous return keeps decreasing as shown by the downwards trend on vascular curve (starting at the end of the knee). Hope this helps!
you are a legend
it was amazing omg i learned by heartttttttttttttttttttttttttttttttttttttttttttttttttttttttttttttttttttttttttttttttttttt
You’re the best
You said after increasing TPR blood flows slowly to vein and blood flow decreases to right atrium. So why the msp doesn’t go down? By the way I really liked your explanation. .
When the veins receive reduced blood, their compliance goes down. That results in increased pressure (P=V/C). This increasing pressure brings the msp back to normal. Hope this helps. Remember blood shift to arterial side reduces venous compliance. Blood shift to venous side increases venous compliance. These changes in compliance keep the msp in check. So the only way to change msp is either lose blood from the system. Or make vein constricted or relaxed.
THANKYOU SO MUCH 😭
Greattttttttt !!!! thanks a lot 👍👍🥀
A QUESTIONS, HAVE U THE BIBLIOGRAPHY???
Thank you so so so so so much!!!!
Why does an increase in venous tone cause an increase in venous return (veins--> right atrium), but constricting the arterioles causes a decrease in blood flow from arteries to veins. It doesn't make sense to me that constriction has different effects in these 2 situations. Thanks in advance
In real life, veins are constricted by muscles but not all the veins are constricted simultaneously. So let's say the calf muscles constrict the veins in the legs but those in the upper body are still relaxed. So the blood goes from the legs towards the upper body and the right atrium eventually. Hope that makes sense
@@GRABtheMD Thank you very much.
amazing video!!!
Thank you so much for the video! I have a question though, how does TPR not affect the mean systemic pressure/right atrial pressure? the venous return is increased, meaning that the blood volume to the heart is increased, so why does the RAP remain the same?
If you read the last sentence in First Aid under this section, it says in real life it's a mix of things. Everything can change everything. But for Step 1 we should stick to some rules. So unless you put more blood into the circulation, msp won't change. That's how I used to think when answering the questions.
@@GRABtheMD thank you for replying!
Awesome and amazing
If we increase the CO wouldn't the VR increase as well, for instance during an increase in inotropy ?
Real life: mostly likely yes
Exams: no. Treat them as separate things, changed by different variables
But Increasd CO should affect the VR..thus the Vascular curve should also be altered with Cardiac function work in case of Pos/neg inotrophy..Right?
Thank u sooo much bro 😍😍😍
Effect of inotropy on VR ??
Can you explain why MSP does not change when you vasodilate or vasoconstrict? Thank you
Vasodilation and vasoconstriction in this context is related to arteries. MSP is related to venous system that's why it's not altered by Vasodilation and vasoconstriction of arteries. Hope that helps
Please make more vidoes on Usmle step 1
Please please upload more videos on other chapters
Incredible!
Thank you. Please share with your mates
I thought increased venous return meant decreased atrial pressure?
Hi i have a question. When atrial pressure increases venous return decreases but why in the graph they are both increasing and decreasing together?
RAP follows the x-axis. If we move right on the x-axis, the RAP increases. Now look at what happens to the VR curve (blue) as we move right on the x-axis. It comes down (decreases). Hope that helps ✌️
@@GRABtheMDI'm sorry I'm asking again but at 9.54 u said that vr increases rap also increase? I'm not getting it.
@@ritvikahada9827 alright I see what's causing the confusion. In this case I am putting more blood into the RA which will stretch the RA and increase it's pressure. But at the same time I am keeping the cardiac output higher than normal, so whatever comes into the RA, gets out of it, and it does not exert backwards pressure on the veins to reduce the VR. If I keep the CO at normal and increase the VR, the RA pressure will go up but this time it will exert back pressure on venous return to decrease it. I wish I could explain it better
@@GRABtheMD now I got it thankyou so much for Explaining it so well.
I dont understand how this stament is true: An increased blood volume (or venous tone) causes the cardiac output to increase and right atrial pressure to increase
if the graph doesn't show increase in CO
could someone help how to see increase of CO in the graph when venous return is changed?
can someone explain if the cardiac output changes with changes in the blood volume(second graph)? it should decrease with a decrease in blood volume or venous tone,right?
You are right. It does decrease
@@GRABtheMD okay,thank you,great video,very helpful
thankkkks got the question right
When does the pressure in arteries equal the central venous pressure?
When we stop the heart. It could be done experimentally in lab animals. It's also observed during ventricular fibrillation when the heart is not being able to pump any blood (and could be considered a non-beating heart)
@@GRABtheMD thank you so much!
question : (btw i don't disagree with your explanation) why do we administer pressor agents with septic shock (if there is a decrease in CO) ?
If I remember correctly, septic shock gives a High Output Cardiac failure (not low CO). The main problem is vasoldilation which leads to very low tpr which causes poor perfusion of end organs. So to increase tpr, we give them vasopressors. I hope I am not wrong
You are the Legeng bro❤️:;; but plz clear one question that why increase or decrease in the Cardiac output has no effect on MSP (as change in CO has effect on venous return too) plz clear it 😭🙏
MSFP represents the pressure generated by elastic recoil in the systemic circulation during a no-flow state. When we bring cardiac output to the discussion, it means we are not talking about a no-flow state anymore. MSP depends upon the elastic recoil of veins (put more blood into the veins from outside => veins will stretch out more => veins will recoil back with force => increase MSP). Hope this makes sense
@@GRABtheMD got it thanks ❤️