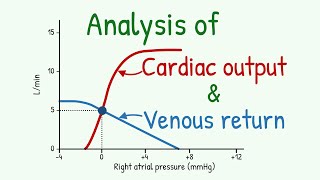
@4:55 it seems like the pathologic venous curve has the same MSFP as normal, implying that the negative slope has actually gotten flatter. That situation would not indicate lower Blood volume (or reduced venous tone--parasympathetics) but Higher TPR (or afterload). That's why raising afterload reduces Cardiac Output--without changing the system's volumes.
Same confusion. Also doesn't make sense that MSFP is the same with lower venous return and yet the CO is at baseline/increased. The figure is wrong i believe
The pathologic return curve is incorrectly explained. It cannot be caused by a lower volume because then you wouldn't have the same pressure at 0 CO, it would therefore be shifted to the left while staying parallel to the baseline return curve.
I can’t understand the knee in the vascular function curve, why the venous are collapsing if in the atrium there is a negative pressure, why not just the venous return increase as the pressure gradient has increased 🤯
Maximum venous return occurs at -4 mm Hg (RAP) and further drops in pressure will not increase venous return because the veins will collapse below -4 mm Hg as the luminal pressure becomes less than the extramural pressure. As right atrial pressure, which is equal to venous pressure anywhere within the thorax, falls below atmospheric pressure, some veins just outside their point of entry into the thorax may collapse during inspiration, as their intraluminal pressure falls below atmospheric pressure. As central venous pressure falls lower, more veins may collapse for longer portions of the respiratory cycle, while below -4 mm Hg, essentially, all veins in the chest remain collapsed until the buildup of upstream blood increases their intraluminal pressure to -4 mm Hg or greater. The collapse of the veins increases resistance to venous return, which is the inverse of the slope of the relationship between flow and right atrial pressure. Ultimately, resistance becomes infinite below -4 mm Hg, preventing any increase in flow above that present at -4 mm Hg. The resistance increases progressively as right atrial pressure falls from approximately -2 to -4 mm Hg, causing the plotted relationship between pressure and flow to be curvilinear in this range.
This was not very good. NO explanation even attempted in order to explain why your "pathological" venous return curve has the same MSFP as control, especially when you invoked decreased blood volume as a cause, whereas the right-shifted increased venous return curve was claimed to be a result of the opposite, i.e. increased blood volume. Regarding the drop to point D--if you lower total volume (your example was dehydration), you lower MSFP, so the venous return curve should not have the same MSFP as the control curve. IOW, the new lower venous fxn curve should be a line that's left shifted and parallel to the control curve, with a lower, NOT the same MSFP. The lower venous return curve WOULD be produced by something like increased total peripheral resistance, since that would decrease both cardiac output and venous return WITHOUT affecting MSFP. You need to either edit this accordingly, or delete it completely, because you are misinforming people here.
why is it that the cardiac function curve often plateaus? Does this mean that the extra blood simply regurgitates back into the atrium because the ventricle is too full? But then I see that RA pressure and EDV are used interchangeablely so this can't be the reason? tbh, I don't even understand the axes and the vascular function curve.... are CO and venous return really synonymous (y-axis)? If not, then it seems inappropriate to graph two curves on the same plot? For example, if you look at the vascular function curve, how is it possible to have positive "cardiac output" when there is no RA pressure?
The reason why CO curve plateaus is because the Frank Starling mechanism can only stretch till a certain degree to increase CO, further increases cannot increase contractility The atria and ventricles are chambers, the chambers have to be filled with certain amount of blood for the pressure to be registered, you can have low volumes of blood without much pressure on the heart chambers


@4:55 it seems like the pathologic venous curve has the same MSFP as normal, implying that the negative slope has actually gotten flatter. That situation would not indicate lower Blood volume (or reduced venous tone--parasympathetics) but Higher TPR (or afterload). That's why raising afterload reduces Cardiac Output--without changing the system's volumes.
Same confusion. Also doesn't make sense that MSFP is the same with lower venous return and yet the CO is at baseline/increased. The figure is wrong i believe
The pathologic return curve is incorrectly explained. It cannot be caused by a lower volume because then you wouldn't have the same pressure at 0 CO, it would therefore be shifted to the left while staying parallel to the baseline return curve.
Why does decreased VR curve has same MSFP as normal curve ? I'd have liked if u have talked more about cvp/x axis
amazing
fantastic explanations!
can you explain why the mean systemic pressure doesn't change on the x-axis?
A loss of volume would shift the venous curve left and parallel to the baseline curve since mean systemic volume would be decreased.
Thank you so much
having the venous return with the same msfp is misleading i think ?
Great. Super.
Thank you! Cheers!
I can’t understand the knee in the vascular function curve, why the venous are collapsing if in the atrium there is a negative pressure, why not just the venous return increase as the pressure gradient has increased 🤯
Maximum venous return occurs at -4 mm Hg (RAP) and further drops in pressure will not increase venous return because the veins will collapse below -4 mm Hg as the luminal pressure becomes less than the extramural pressure.
As right atrial pressure, which is equal to venous pressure anywhere within the thorax, falls below atmospheric pressure, some veins just outside their point of entry into the thorax may collapse during inspiration, as their intraluminal pressure falls below atmospheric pressure. As central venous pressure falls lower, more veins may collapse for longer portions of the respiratory cycle, while below -4 mm Hg, essentially, all veins in the chest remain collapsed until the buildup of upstream blood increases their intraluminal pressure to -4 mm Hg or greater. The collapse of the veins increases resistance to venous return, which is the inverse of the slope of the relationship between flow and right atrial pressure. Ultimately, resistance becomes infinite below -4 mm Hg, preventing any increase in flow above that present at -4 mm Hg. The resistance increases progressively as right atrial pressure falls from approximately -2 to -4 mm Hg, causing the plotted relationship between pressure and flow to be curvilinear in this range.
This was not very good. NO explanation even attempted in order to explain why your "pathological" venous return curve has the same MSFP as control, especially when you invoked decreased blood volume as a cause, whereas the right-shifted increased venous return curve was claimed to be a result of the opposite, i.e. increased blood volume. Regarding the drop to point D--if you lower total volume (your example was dehydration), you lower MSFP, so the venous return curve should not have the same MSFP as the control curve. IOW, the new lower venous fxn curve should be a line that's left shifted and parallel to the control curve, with a lower, NOT the same MSFP.
The lower venous return curve WOULD be produced by something like increased total peripheral resistance, since that would decrease both cardiac output and venous return WITHOUT affecting MSFP.
You need to either edit this accordingly, or delete it completely, because you are misinforming people here.
why is it that the cardiac function curve often plateaus? Does this mean that the extra blood simply regurgitates back into the atrium because the ventricle is too full? But then I see that RA pressure and EDV are used interchangeablely so this can't be the reason?
tbh, I don't even understand the axes and the vascular function curve.... are CO and venous return really synonymous (y-axis)? If not, then it seems inappropriate to graph two curves on the same plot? For example, if you look at the vascular function curve, how is it possible to have positive "cardiac output" when there is no RA pressure?
The reason why CO curve plateaus is because the Frank Starling mechanism can only stretch till a certain degree to increase CO, further increases cannot increase contractility
The atria and ventricles are chambers, the chambers have to be filled with certain amount of blood for the pressure to be registered, you can have low volumes of blood without much pressure on the heart chambers