Z Scores in SPSS: How to Calculate and Interpret z Scores in SPSS

HTML-код
- Опубликовано: 15 июл 2024
- How to obtain z scores in SPSS is illustrated. The Property of z-scores having a mean of 0 and a standard deviation of 1 is also illustrated with the data.
Check out our next text, 'SPSS Cheat Sheet,' here: goo.gl/b8sRHa. Prime and 'Unlimited' members, get our text for free! (Only $4.99 otherwise, but will likely increase soon.)
For additional SPSS/Statistics videos:
SPSS Descriptive Statistics Videos: tinyurl.com/lyxnk72
SPSS Inferential Statistics Videos: tinyurl.com/lm9hpwc
z scores
standardized scores
z score in SPSS
z score video SPSS
RUclips Channel: www.youtube.com\/user/statisticsinstructor
Video Transcript:
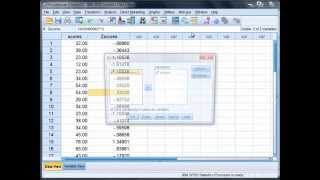
In this tutorial we're going to examine how to calculate and interpret z-scores in SPSS. So here notice we have the variable, scores, and on this variable we have a score for each of 23 people in total. Now to calculate z scores on this variable what we want to do is go to Analyze on the menu bar, select Descriptive Statistics, and then select our option Descriptives here. Move the variable, scores, over to the Variable(s) box. And then right here Save standardized values as variables we want to click on this box, and when we do that this is what is going to produce the z-scores in SPSS. Let's go ahead and go to Options as well. And under Options notice we have the Mean and Standard deviation selected by default as well as Minimum and Maximum. Let's go ahead and deselect Minimum and Maximum for now. Click Continue. And then click OK. The SPSS output window Opens and here we have just one table of output where we have the mean and standard deviation for the variable, scores. OK so you may ask yourself what happened, where are the z-scores? Well the z-scores are actually provided in the Data Editor window. So if we click here we'll go back to our Data Editor and notice this column now, Zscores. So we have a z-score for each of the original scores, a z-score is calculated and provided in SPSS. If we go to our output here by clicking on Window and select Output then you will see here in our output we have a mean if we round to a whole number place the mean is equal to 47, rounding once again to a whole number. OK so a mean of 47, keep that in mind. Let's go back to our data. Let's take a few of these as an example. Here we have a score of 32. Recall that the mean was 47 when we rounded. 32 is below 47 and notice how our z score is negative. 39 is also less than 47 and notice how our z-score is once again negative. Moving down here to observation 7, 54 that's greater than or mean of 47, and notice now that our z-score is positive. Taking one more example, 76, that's also greater than the mean of 47, and once again our z-score is positive. This illustrates a property of z-scores. And that is, values that are less than the mean of 47 would produce negative z- scores, whereas values that are greater than the mean of 47 would produce positive z- scores. OK that's a basic property of the z-score distribution. Now something else that's interesting and you may have learned in your introductory statistics course is what the mean and standard deviation of a z-score distribution is equal to. Let's take a look at that on our own. Go to Analyze, Descriptive Statistics, and then go to Descriptives once again. And then now let's move our new variable notice this variable here Zscore. This is new, we produced it by checking on this box before. Let's move it over and then let's deselect this this time because we already have our z-score variable. Click OK. And now notice what we get here in our output, in this second table here. We have the same mean and standard deviation for scores as we did before which shouldn't be surprising since it's the same variable. But this is where it's interesting. Notice the mean and standard deviation for the z-score variable. Now this here is scientific notation zero e to the negative 7 and what that means is it's point six zeros and a number so .000000 and then some number. In other words, it's very, very small and what that really means is just rounding error. This value is really zero for all intents and purposes. It's just a rounding error. So the mean is equal to 0 and the standard deviation is equal to 1, which is another property of a z-score distribution. If you take any variable in SPSS no matter what the values are and you calculate z-scores on that variable and you obtain a mean and standard deviation of the new z-score variable, the z-score variable will always have a mean of zero and a standard deviation of one just as we see right here. Just keep in mind there may be a little bit of rounding error. This concludes the tutorial on obtaining z-scores in SPSS.
Lifetime access to SPSS videos: tinyurl.com/m2532td


I appreciate this man. Thanks very much. I pray every do great in their statistics class.🙏🏽
Very clearly explained. Thank you. Another great presentation!
Thank you. This was informative and well explained.
you are a life saver, very clear and concise. thank you so much
This video has been very helpful.
Great job!
THANK YOU VERY MUCH!! YOUR EXPLANATION IS VARY CLEAR AND HELPFUL! BARAKALLAH!
mood rn
Thank you for you video, but how would you go about reporting the results in a result section
Very good explanation. Thank you!
My pleasure, Bob!
Thank you ver much.
How is Altman Z ratio calculation done?
Can you make a sample application with five arguments?
Thank YOU 🐩
Good job!Very helpful and explanatory video..Maybe you could explain that z follows the normal standardised distribution and for this reason has mean equals to zero and s.d equals to one.
E(z) = E((x-μ)/σ) = E(x/σ-μ/σ ) = 1/σ Ε(x) - μ/σ = μ/σ - μ/σ = 0
Var(z) = Var((x-μ)/σ) = 1/σ^2 Var(x - μ) = 1/σ^2 [Var(x) - Var(μ)] = 1/σ^2 (σ^2 - 0) = = 1
How do you interpret in APA?
how to tabulate value of z score??? i mean in accordance with variable like how we write it in tabulation that weight have this z-score, hight have this z score, etc etc... because in spss it appears in a looooonnnnng row, and not as single digit equal to your number of observations.... like i made 50 observations on hight and weight, so z score appear 50, and not as single and one entity. how can we change it???? is it the mean z score which you mentioned in video???
So if all mean zscore .000000 and all std 1.000000 how do i interpret that? Do i say data normally distributed or something similar?
Good evening, sir, please, how can I compare or evaluate the growth of children by height and weight with reference curves for height and weight at different ages according to the World Health Organization according to z-score
Did you found a solution please ?
Your voice sounds a lot like Joaquin Phoenix's Joker
very blurry. You should redo the video.