Hi - you can think of the DF/DFmax ratio as the fraction of RNA molecules that have a substrate bound. DF is the normalized signal that comes from an experiment (typically a fluorescence signal) and DFmax is the maximum normalized signal.
Hi - you'd need to pick an emission wavelength that changes as the ligand binds. Assign an initial value and a final value - these are essentially the same as DFinitial and DFmax in this video. The fractional saturation term would be fractional change / total change = (current - initial)/(final - initial). Then everything else would be the same as in this video assuming that it is a simple 1:1 stoichiometry
Yep - as long as you have an equation that describes the binding. It would be very similar to the equation shown here. The fractional saturation (DF/DFmax) would be calculated as the %change at a single wavelength.


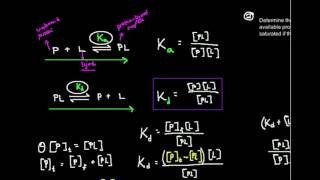


what's DF and DFmax? What are they?
Hi - you can think of the DF/DFmax ratio as the fraction of RNA molecules that have a substrate bound. DF is the normalized signal that comes from an experiment (typically a fluorescence signal) and DFmax is the maximum normalized signal.
how did you calculated experimental value of DF/DFmax?
DF is the experimental value and DF max is the signal when it is fully saturated with ligand. So the Y-axis is a fraction of bound ligand.
Hey how can calculate the kd of a group data with fluorescence intensity spectrum and concentration? thanks
Hi - you'd need to pick an emission wavelength that changes as the ligand binds. Assign an initial value and a final value - these are essentially the same as DFinitial and DFmax in this video. The fractional saturation term would be fractional change / total change = (current - initial)/(final - initial). Then everything else would be the same as in this video assuming that it is a simple 1:1 stoichiometry
Great!
Hey can you calculate binding constant from uv spectophotometer
Yep - as long as you have an equation that describes the binding. It would be very similar to the equation shown here. The fractional saturation (DF/DFmax) would be calculated as the %change at a single wavelength.
thanks