This is awesome Chandoo.. can you also do a video on connecting Power query to SQL or Oracle or SAS directly to pull data? I wasn't successful, so wondering!
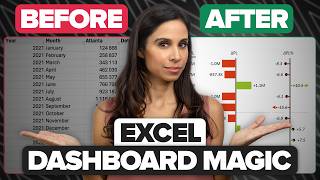
I've always found Excel a bit ugly/clunky at data visualisation. Especially making a dashboard. It seems to take a lot of tinkering to make something that looks nice compared to PowerBi. This Kickass Chart really is and ups the game. Brilliant Chandoo. Very helpful.
Thanks a lot, very nice tricks indeed. I am more interested in recreating the Zebra one, without the shape change of course, but just make like this with a drop down list to view different information.
I like so much Power Bi. Indeed, a little slow for starting (5 min) , but really a big deal. To compare: excel needs less than 1 min on my 4 gb / 2,4 ghz lapi.
Hey Chandoo! Thanks for another amazing vídeo! Can you please tell me what computer you use? Is it still the same that you present in your setup video?
Thank you so much for the videos. I found you and this is been so helpful. Do you have any videos on hidden a column and protecting so no one opens but at the same time they are able to make changes to the rest of the worksheet?
Pivot Charts will show all the data in your Pivot Report. So one easy way to replicate this is to use Pivot for Actual & Target values and do the calculations outside and use that range to set up the chart. If you use "references" in the chart range, whenever your pivot changes (Refresh / slicer), the chart gets updated too. Or just use the Zebra chart, which links up to pivots by default.
Thank you Chandoo. it is really good chart but which printing or concerting it to pdf, it does'n show green or red signals. it shows black/gray only as shows in excel cells. Is there any solution for that?
Chandoo thanks in advance.. I am using excel 2013 version , where I tried to insert emojis by using windows +. Keys simultaneously , but no emojis are reflecting. Can u help me on this...your videos are very nice..
Hi Srini... the emoji keypad is supported since Windows 8. (I think). So if you have a older version of Windows, you can use a site like emojipedia, search for the emoji you want, copy it and paste it in Excel.
Hey chandu could you please let me know from where i need to start freelancer work i mean tell me the website name who provide work for freelancing work
When I tried to do it with sample data, I got the emojis but not in colours, all emojis are reflecting black in the chart as well. Help me with this please.
hi, i have 10 line of data.. i was copied them from different sheet and I need to paste it to my excel sheet in column 2 , but i have some data in column 8 .. so how can I paste 10 lines of data without affecting 8th column of data
You are welcome, Francesco. They always appear in black & white in the cells, but show up in color on the chart / textboxes in most recent versions of Excel. In future they might even show up in cells in color.


Beautiful chart Chandoo. Thank you.
I really love and respect you CHANDOO, you’ve changed my understanding to excel and how t works, appreciate your efforts.
To be honest I liked the chart you made.
This is awesome Chandoo.. can you also do a video on connecting Power query to SQL or Oracle or SAS directly to pull data? I wasn't successful, so wondering!
Amazing and awesome Chandoo. Thumbs up and hats off for such a wonderful input
Awesome....easy & impactful with sheer beauty...you are magical Mr. C ... remember na 😊 Thanks for sharing
Love that formula and solution! Thank you!
One of the best ones I've seen so far, thank you for sharing!
Glad you enjoyed it!
This awesome!!!! Thank you for sharing😀
That was absolutely brilliant. Thank you so much!
I've always found Excel a bit ugly/clunky at data visualisation. Especially making a dashboard. It seems to take a lot of tinkering to make something that looks nice compared to PowerBi. This Kickass Chart really is and ups the game. Brilliant Chandoo. Very helpful.
Thanks a lot, very nice tricks indeed. I am more interested in recreating the Zebra one, without the shape change of course, but just make like this with a drop down list to view different information.
HI, you can try it yourself - we have a 100% free version, too :)
You are amazing @chandoo 😍😱
Great video, I will look for zebra as well. Thank you!
Let us know how you like it :)
Very thanks a lot Chandoo. Your content help me so much ☺️
This one damn good, very useful. Thank you very much.
Hi Chandoo. Beautiful chart. What happens if one of your seven of your variables variance is in millions, does the "K" still apply
As always, brilliant. Definitely going to have a play with Zebra.
Your tutoraial is very humorous and helpful. Thank you so much Chandoo. Do you know Chandoo is name of a Chinese city.
Excellent Chandoo!
Wonderful! Absolutely beautiful
Man, I just love all your content!
Glad you enjoy it!
This did a really good work for my chart. Thank you!!
Love the enhanced animations bro ❤
Great Chandoo….
Pl make videos on advanced Waterfall charts
Awesome 👌 report style...and thanks for Zebra Bi information.
Thank you chandoo ❤
Lots of customisation.. available in Excel.. Wow..
Very nice sir.,💐💐💐
Explanation is good sir
Thank you for awesome techniques 🙏🙏
Happy Diwali 🙏🙏
Wow❤ great knowledge sharing
Thanks a lot chandoo
awesome as usual
Awesome.Thank You ❤️❤️
Thanks! I am learning alot from you.. Happy Diwali✨✨
Happy diwali chandoo 😀🏮🏮
Happy Diwali to you too Anurag 😀
Kickass trick. Thanks da 😄
Thanks, that was awesome a quick question what if the figures are in millions
I like so much Power Bi. Indeed, a little slow for starting (5 min) , but really a big deal. To compare: excel needs less than 1 min on my 4 gb / 2,4 ghz lapi.
Very helpful
Hey Chandoo! Thanks for another amazing vídeo! Can you please tell me what computer you use? Is it still the same that you present in your setup video?
Happy Diwali Chandoo💥
Thank you so much for the videos. I found you and this is been so helpful. Do you have any videos on hidden a column and protecting so no one opens but at the same time they are able to make changes to the rest of the worksheet?
Hey brother happy diwali anna.
You looks like an Vicky Kaushal
Thank you
Awesome visual Chandoo. Is there any way we can create this same visual in Power Bi too.
🙏🙏🙏🙏thank you
Chandoo, I got the trial version. But I can’t seem to get the chart that you used for this video?
This is crazy as a zebra 🦓
Have you tried it with your data already? :)
This is great. Does this method work when creating a calculation field in a pivot table?
Pivot Charts will show all the data in your Pivot Report. So one easy way to replicate this is to use Pivot for Actual & Target values and do the calculations outside and use that range to set up the chart. If you use "references" in the chart range, whenever your pivot changes (Refresh / slicer), the chart gets updated too.
Or just use the Zebra chart, which links up to pivots by default.
Thank you Chandoo. it is really good chart but which printing or concerting it to pdf, it does'n show green or red signals. it shows black/gray only as shows in excel cells. Is there any solution for that?
great
😂😂😂😂 having fun while learning
Nice chart chandoo. One issue in the chart, emojis are in black & white on the chart and not in color.
They should be in color in most new versions of Excel & Windows. What version are you using?
Could you kindly discount on Excel course
what would the formula be if you wanted to show the variance as a percentage instead of absolute value?
You can use =this month / last month - 1 to get the % variance.
Chandoo thanks in advance.. I am using excel 2013 version , where I tried to insert emojis by using windows +. Keys simultaneously , but no emojis are reflecting. Can u help me on this...your videos are very nice..
Hi Srini... the emoji keypad is supported since Windows 8. (I think). So if you have a older version of Windows, you can use a site like emojipedia, search for the emoji you want, copy it and paste it in Excel.
@@chandoo_ thank you..
do you create custom charts or templates
Yes, I do. Feel free to email me from chandoo.org/wp/contact
Hi i practiced . However in my excel red and green not shwoing after forming
Hey chandu could you please let me know from where i need to start freelancer work i mean tell me the website name who provide work for freelancing work
I have problem with my data model in power bi
Can you pls help me....?
When I tried to do it with sample data, I got the emojis but not in colours, all emojis are reflecting black in the chart as well. Help me with this please.
The Zebra add-in is not showing up when I search for "zebra". Does that mean I don't have the best version of Excel? I have Office 2019.
Hmm.. not sure if it is compatible with 2019. Use the link to download the add-in - bit.ly/3TAATU3
hi, i have 10 line of data.. i was copied them from different sheet and I need to paste it to my excel sheet in column 2 , but i have some data in column 8 .. so how can I paste 10 lines of data without affecting 8th column of data
please help me
I love you ❤
👏👏👏
Thanks! Do you Know why my emojis are in black and white?
You are welcome, Francesco. They always appear in black & white in the cells, but show up in color on the chart / textboxes in most recent versions of Excel. In future they might even show up in cells in color.
@@chandoo_ thank you so much
Thnx but it doesn't work in Excel 2016
👏👏👏👏👏
1st comment