Это видео недоступно.
Сожалеем об этом.
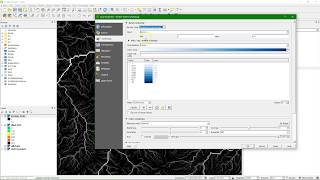
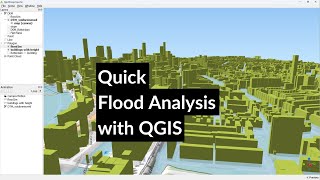
Make quick inundation maps in QGIS using Open Data

HTML-код
- Опубликовано: 14 авг 2018
- This video shows how to make quick inundation maps using QGIS, SRTM DEM and OpenStreetMap.
This video is part of IHE Delft OpenCourseWare. More free resources can be found at www.gisopencour...
For an overview of our GIS courses and info on tailor made trainings and advise see our folder: www.un-ihe.org...
More information about the book "QGIS for Hydrological Applications - Recipes for Catchment Hydrology and Water Management" by Kurt Menke and Hans van der Kwast can be found at the website of Locate Press: www.locatepress...
IHE Delft and Nieuwland Geoinformatie offer an online course. It includes support from experienced trainers and you'll get the official QGIS certificate after completion. More info at: www.learning-gi...
Subscribe to the RUclips Channel for updates!
Credits to OpenStreetMap data: © OpenStreetMap contributors


Such an excellent presentation, I have learned so much! thank you.
thank you so much, that helped me a lot!!!
LOVE U BRO
Thanks bro, its better to spread knowledge to others.
Thanks for this video it did help but still struggling with the 3D, tables not similar maybe I got the lower version. Still I work my way up to polygonized.
Many folks here have asked about making this model capable of displaying a flood that begins from a point or from a coastal surge. I am also wondering this and I have an idea.
Remove flooded pixels that are in small groups.
This solution does not require modeling the hydrology nor does it require additional layers. This solution does not consider hydrologic connectivity, but I think it gets the job done. I think that in most cases, these flooded pixels that are outside of hydrologically-connected areas will be in small groups of pixels. Therefor, you could use a tool that removes groups of pixels that are under a set number.
Let me know what you think and please leave your solution. I currently have a project to map tsunami risk areas in Aceh, Indonesia. So, any ideas will be useful.
ps. another idea: Use a tool that creates polygons around pixels, then, select the polygon of interest and delete the rest.
This was really helpful! Thanks!
Hello sir, I have a question.
The method you used here is referred to as a 'bathtub model' and is widely used to predict coastal flooding and land inundation. However, this model does not incorporate hydrological connectivity.
This means that for isolated areas that are inland and show up as 'flooded' in the output, there may actually be no way for the water to get there in the first place (as you can see in your video).
What can you do in QGIS to include hydrological connectivity to your model? I know that you can simply vectorise the raster image of the flooded cells like you've done here and then use the identify features tool to manually delete this, but this may not be feasible for larger areas as it would simply take too much time. I guess what I'm after is more of an expression to enter in the raster calculator, or a tool in the processing tool box rather than manually deleting the vectors and then re-rasterizing it.
Normally a hydraulic model output is used for that. Otherwise it's probably it bit more complicated to deal with in QGIS. You can try to use the flow accumulation functions of the PCRaster Tools plugin to introduce hydrological connectivity.
Good morning Sir
I have a question please ,
Did Qgis developed new tools that helps for river modelling and flood mapping analysis
And if it is available do you plan to present this tools in the future .
Thank you
thank you for this video. do you know if it is possible to apply similar approaches to estimate the (downstream) area impacted by a flood starting from one (or multiple) vector point(s) ? thank you
if i download in US government site is it any problem in future
tnx! really appreciated.
How do I download the Open Topography Plugin if it’s not in the plugins section and there is no RAR Install option?
The OpenTopography DEM Downloader plugin should be available through the plugins manager. If it doesn't show up, it means that your QGIS doesn't connect through internet with the repository, or you are using a very old version of QGIS that is not supported by the plugin. Here's the video about the plugin (where your question belongs to keep things on-topic): ruclips.net/video/EMwPT7tABCg/видео.htmlsi=VOoxwH6bLozBZgTK
Installing from RAR doesn't exist. You can install from Zip. You need to download the and zip the source code from github.com/knwin/OpenTopography-DEM-Downloader-qgis-plugin
Can I please have the link of the Version of QGIS that u used in the video? I downloaded the same version but some of the options were not there
I’m a student from the Philippines and I need help in making a flood map for my Research Study. If I won’t be able to do this, I won’t graduate. Is there any way you can help me to create a flood map?
At the start of this video (the one you're commenting on now) it shows version 2.18. You should not use this. The video is very old. You should use QGIS 3.28 or newer. Use this new video instead: ruclips.net/video/PL5ScexN78Q/видео.html. Instead of using the Dutch data, the only thing you need to do differently is find a DSM of your own study area. You can always fall back on a coarse global DEM, using the OpenTopography DEM Downloader plugin, if nothing else is available.
Is there any other way I can contact you? Email, Telegram or anything? I just really need help for my Research Study, I am willing to pay for some knowledge and guidance. Please
How to find the open data?
You can download the DEM using the OpenTopography DEM Downloader plugin: ruclips.net/video/EMwPT7tABCg/видео.htmlsi=ZGtWJetNsznn6Acr
You can download the buildings from OpenStreetMap using the QuickOSM plugin: ruclips.net/video/cOxd1zJ_rqI/видео.htmlsi=VJaIsLZ1V__AsGmJ
Dear Hans thank you for this video. Is it possible to make the inundation map by incorporating the rain data as well?
Best Regards
Then you need to make a model that transfers the rainfall into water level rise.
Thanks alot for the video, Would you help me how to get DTM 1 m for Padang West Sumatra Indonesia..?, Thanks..
That's a question for your government. In the Netherlands we have 50 cm DTM available for free. See here for a discussion: gt20.eu/news/blog-how-can-european-open-data-developments-inspire-the-rest-of-the-world/
thank u for this incredible video . just a quick question, how can I share the 3dimensional aspect of the map?
Hi Tulika. You can save the 3D view as a website in the Qgis2threejs plugin. Go to File-->Export to Web... Choose a folder to save it and check the box "Enable Viewer to Run Locally". Then go to the index.html in the folder and double click to open it in your default browser.
Thanks you for this video. I have question, what is the name of the method used in this video ?
There's no specific name. I just combined some GIS tools to make quick inundation maps.
Hi Hans ! Pretty cool exercise. This can also be used to have a rough estimation of the financial impact of these hypothetical floods if the buildings taken from OSM can be classified according to their value. Do you know of a way how that can be done ?
Hi Walid. That can be done with so called Flood Damage Curves. See for example: ec.europa.eu/jrc/en/publication/global-flood-depth-damage-functions-methodology-and-database-guidelines
Nice one
Sensacional!
I have used a DEM for 12.5m i get strange results almost half of the city is Flooded) any recommendation???
I used ALOS DEM it gives different result any help SIR???
Prof Hans
This should be very straightforward. Check your elevation raster and verify its vertical units. In this video we simply do map algebra with those values. Thry to understand the equations and how it relates to your DEM.
@@HansvanderKwast okay i used the USGS DEM(-3 to 44m) the results came perfectly reasonable but upon using the ALOS DEM the results differ as in My Elevation Raster ranges from -30 to 17m i did the same DEM
unless otherwise then, i need to research more on ALOS DEM on the analysis
where to find the clip extent to the canvas in Qgis 3.16? i can't find it.
Go to Raster --> Extraction --> Clip Raster by Extent. Use the drop down for Clipping extent to choose Use map canvas extent.
@@HansvanderKwast I am sorry I forgot to mention that I am asking a question regarding this video, here in this video at 3:33 you chose the clip to canvas extent and then you clicked load, that load button I can't find in Qgis 3.16.
@@Vikas20a In the Layer styling panel under Min/Max Value Settings --> Statistics extent, choose Current canvas. Then it will stretch the colours for the extent of the map canvas. If you choose there Updated canvas, it will update automatically when you change the extent (when you pan/zoom).
@@HansvanderKwast thank you, and please help me in another problem that my min and maz values is 22-80 and city is situated on the bank of Ganga River India.