Quick Flood Analysis with QGIS

HTML-код
- Опубликовано: 13 июл 2024
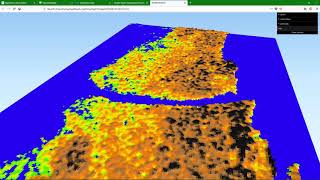
- In this video, we'll use building footprints from OpenStreetMap, a DTM and a DSM to create 2D and 3D flood maps of a city. We'll start with preprocessing the data: interpolate voids in the DTM and extrude buildings, using the DSM and zonal statistics. Next, we'll prepare flood extent layers. Finally, we'll visualize the flood extent in 3D.
QGIS version: 3.34 Prizren
Open data: AHN, (c) OpenStreetMap contributors
Plugins: QuickOSM, PDOK Services, Qgis2threejs
0:00 Introduction
0:26 Download buildings from OpenStreetMap
1:58 Download DTM and DSM via PDOK Services plugin
4:35 Interpolate voids in DTM
6:18 Calculate slope
7:18 Extrude buildings
10:37 Prepare flood extent layer
12:56 3D visualization of flood extent
#QGIS #urban


holy wow. this kind of tutorial is amazing. I haven't done anything like this one before.
Top!, thank you Hans!
I recently did a similar analysis for Overijssel area... So inspiring
Mooie tutorial! Ik heb recent voor het zelfde gebied wat overstromingskaarten gemaakt voor het buitendijkse gebied met de r.fill tool. Eens kijken of ik ze ook mooi 3d kan weergeven.
First of all thanks very much for this amazing tutorial. I want to do the same analysis for an area in Germany, but I could not find DTM and DSM with higher resolution than 30m. Would this type of analysis work with such resolutions?
Thank you sir for the tutorial, does this method also work for sea surface inundation?
A really nice tutorial! Thanks for your hard work in putting this together and sharing it for everyone! Please can you share the spec of the machine you did the work on (RAM, GPU etc) and maybe give an indication of the minimum requirements needed for this kind of work?
I'm using a PC with AMD Ryzen 7, 16GB RAM, GeForce RTX 3060. I think this would also be the recommended specs. Maybe with 8GB RAM it will still work, but I'm thinking of adding another 16GB to have 32.
good question but i am reading it very late since my computer is on fire right now
I want to do this in Asia. Specifically in the Mekong Delta of Vietnam. Currently, the delta is facing climate change, rising sea levels and flooding in urban areas. I really like this video, can you help me analyze flooding like this in Asia?
hi, is there any tutorial on water quality mapping/ spatial distrubution mapping using qgis? and i wonder if its possible. thank you
Thank you for the video can you show how to export the 3D views with legend included. Thanks in advance
is there any other plugin that work globaly to download digital trrain model and digital surface model, this PDOK service plugin just works for Netherland
High resolution DTM / DSM are not available through plugins. You can try it with coarser data. Check OpenTopography DEM Downloader plugin: ruclips.net/video/EMwPT7tABCg/видео.htmlsi=4_f3A3NTqmqQDG2z
On opentopography.org/ you might find higher resolution datasets for your area of interest.
could you make the same tutorial with srt downloader for any other loacation with the same procedure but this time based on DEM
The procedure doesn't change, only the data, so I don't see the need to make a new video. For an example, see: ruclips.net/video/QXQ92oVua3s/видео.htmlsi=Rr7SivxMeYeZDn-p
For downloading DEMs that are globally available, check the OpenTopography Downloader plugin: ruclips.net/video/QXQ92oVua3s/видео.htmlsi=Rr7SivxMeYeZDn-p
"Good morning, sir. Flooding occurs in various places in the forest area. Due to its elevation, the Brahmaputra River is nearby. Can you show me a map? . Please help me
Sir any video?
This is not an easy question. It's either consultancy or you need to work out the steps and ask for guidance at a specific step. Invest first in learning the basics of GIS and the concepts of flood analysis and modelling. You probably even need a hydraulic model. I'm don't have expertise with that.
@@HansvanderKwast Sir, i know basic steps. Flood map i don't Idea
Sir, PDOK plugin, my area not showing
The PDOK Services plugin is only for open data of the government of the Nethetlands. Check if there's data available from your own government or try this approach with global data: ruclips.net/video/QXQ92oVua3s/видео.html
@@HansvanderKwast thank you so much sir.👍
Anyone knows how to get DTM data of Australia and is that the same as DEM data?
Maybe this site helps: www.ga.gov.au/scientific-topics/national-location-information/digital-elevation-data. DEM stands for Digital Elevation Model, DTM is Digital Terrain Model (terrain elevation without man-made and natural objects) and DSM is Digital Surface Model (terrain + man-made and natural objects), see ruclips.net/video/pnAdasqHxGk/видео.htmlsi=yNfBfJWpUVwa37jC
Why can’t I set a non-integer level elevation value in the raster calculator? For example, a request less than 1 meter is possible, but less than 1.3 is not possible. and how to solve this problem
It should work, but note that the result is Boolean:
"DTM_voidsremoved@1"