Spectrofluorimetry/Fluorimetry/Fluorescence Spectroscopy|Principle, Instrumentation, Applications

HTML-код
- Опубликовано: 25 сен 2020
- This video explains about the principle of fluorescence spectroscopy or spectrofluorimetry. It discusses the process of fluorescence with the Jablonski's diagram. It distinguishes the difference between excitation and emission spectrum. The instrumentation of spectrofluorimetry is discussed. The advantages, disadvantages and applications of spectrofluorimetry are also enumerated.
You will be able to
discuss the principles of spectrofluorimetry
State Stoke’s law or Stoke’s shift
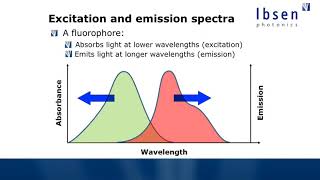
distinguish between the excitation and emission fluorescence spectrum
explain the instrumentation in detail and working of spectrofluorimetry
list out the advantages, disadvantages and applications of spectrofluorimetry.
Principle of Spectrofluorimetry/ Principle of Fluorescence spectroscopy
Spectrofluorimetry or fluorescence spectroscopy is a technique in which UV/Visible light is absorbed by electrons in singlet ground state to move to singlet excited state and returns back to the singlet ground state by emitting radiation (fluorescence) with lower energy (longer wavelength) or same energy to give rise to fluorescence spectroscopy.
Excitation fluorescence spectrum
Emission fluorescence spectrum
Stoke’s shift or Stoke’s law
The fluorescence occurs at a longer wavelength than the excitation wavelength (Difference between the wavelength of emission maxima and absorption maxima)
Resonance fluorescence
The fluorescence wavelength is equal to the excitation wavelength (The process of re-emitting the absorbed energy in the form of light).
Excitation spectrum
plot of intensity of fluorescence emission as a function of excitation wavelength.
Lowest vibrational level of S0 to any vibrational level of S1, S2 etc.
So a band is obtained.
Emission/Fluorescence spectrum
plot of intensity of fluorescence emission against the emission wavelength.
Lowest vibrational level of S1 to any vibrational level of S0.
So a band is obtained.
Instrumentation & working of Spectrofluorimetry/ Instrumentation & working of Fluorescence spectroscopy
Source - Supplies light in the l = 200-800nm - Xenon lamp.
Excitation monochromator - Allows only the excitation wavelength one at a time and absorbs all the other wavelengths and this happens for the complete chosen range of wavelength. eg. diffraction grating.
Sample cell (cuvette) - Sample is placed in it and the cell is polished on all the four sides, as the fluorescence emission is measured at 90o to the incident light. eg. quartz.
Emission/Fluorescence monochromator - Allows only the emission wavelength one at a time and absorbs all the other wavelengths and this happens for the complete chosen range of wavelength. eg. diffraction grating.
Detector - It detects the intensity of the fluorescence light for each wavelength and generates current proportional to it. eg. photomultiplier tube.
Recorder - It records
Excitation fluorescence spectrum - plot of intensity of fluorescence as a function of excitation wavelength.
Emission fluorescence spectrum - plot of intensity of fluorescence against the emission wavelength.
Advantages of Spectrofluorimetry/Advantages of Fluorescence spectroscopy
High sensitivity (ng/ml to mg/ml).
High selectivity (fluorescent substances show specific excitation and emission lmax value).
Disadvantages of Spectrofluorimetry/Disadvantages of Fluorescence spectroscopy
All compounds do not fluoresce.
It is not suitable for identification of compounds.
Contaminants can quench fluorescence and mislead the results.
It is susceptible to pH, solvent polarity, temperature etc.
Applications of Spectrofluorimetry/Applicationsof Fluorescence spectroscopy
Fluorescent probes to detect biological compounds.
Detection of the environmental pollutants.
In geology many minerals and gems can be identified.
Steroids, proteins, plant pigments, drugs can be identified even at low concentrations.
Fluorescent compounds in TLC plates.
Fluorescent detectors are used in HPLC.
Determination of vitamins in food samples, natural products, pharmaceuticals, clinical samples.


Thank you so muth you literally explained everything!! : difference between emission and excitation, why measure on 90°.etc..
Those are all the things I couldnt find on google or in my spectrofotometry book!
It's my pleasure. Thank you.
Wonderful! Thank you for your video!
Thanks. It's my pleasure
This is my introduction to your channel and i must say, great work! My background is in Zoology & i found this helpful. Thanks!
Thanks for your compliments. Glad that it helped you.
😅
😅😅😅😢😅
😅😅😅😢😅
🎉😅😅😅😢😅😅😅
It was really very helpful i was struggling to understand it and u made it very simple
It's my pleasure.
Very good and straight forward class. Congratulations madam.
Thank you very much.
Brilliant explaination..i really learnt Spectrofluorimetry
Thank you so much.
Great explanation ma'am! Thank you!
Thanks for your compliments.
Discovered this channel today..... didn't expected such good content.... subscribed ✌️
Thanks for your support.
Excellent. Thank you so much.
It's my pleasure. Thank you.
Thanks mam for this lecture I found it so helpful 🙂
Thank you very much. It's my pleasure.
Mam it's was amazing 🤩 and really helpfull... thank you so much 💞
It's my pleasure. You are most welcome.
Good explantion. Thank you ...
Thank you. Most welcome
Great presentation it is so useful.
Thank you. I am happy that it helped you.
I did not find the link which you have mentioned in the video.
how could we know whether the compound can be measured through fluorescence. and Can I use DPPH free radical assay for antioxidant with the spectrofluorimetry
Thank you🙏 madam
It's my pleasure.
Mam , can you please tell me some examples of the substance that are not naturally fluorescent.. But we provide them fluorescence artificially.....
Hi ma'am,
Please discuss acid-base titration curve and also discuss indicator
Ma'am mera exam November se start h so please thoda jaldi cover kijiye ga ye topic 🙏🙏🙏🙏🙏
Okay sure
Thank you so much mam❤
It's my pleasure.
Nice and good 💚
Thank you.
Please discuss thermal analysis (all methods) and XRD please
Sure.
very good presentation Mam. By the way do you have the ppt of this? If you have please share it so that it will be useful for every one
Thank you very much.
Nice mam
Thank you.
Super present ation
Thank you very much.
Could pls share your ppt mam. It will be very useful....
Nice video
Thank you.
Fluorimetry and spectro fluorimetry both same or not
Same