This video is just... Perfect timing. Back to a year ago, i just found 'grape messy graph' video from japan from many many years ago. And this channel casually uploaded this video when i find more about it. Just perfect timing and i like it. Plus this video also included the equation suggested by your viewer.
I‘ve got some other heartshaped curves for you: 1. A sort of sine wave that forms into a heart for a parameter a increasing. Let a >= 0, y = x^(2/3)+0.9*sqrt(3.3-x^2)*sin(a*Pi*x) 2. Defines a group of curves together forming a heart (best shown if you draw with it with a trace). Let a be [1,20], (sin(a*Pi/10)+x)^2+(cos(a*Pi/10)+y)^2 = 1+0.7*|x|*y I hope I wrote it down correctly, if it doesn‘t work let me know! I would have some for 3D, but that‘s for another day…
Very cool. Here are some interesting complex number functions. You'll need GeoGebra or something similar since Desmos can't understand imaginary numbers. Lasers: sin(i*x) Repeating circles: i^x distorted grid: x^i I can't think of anything: i*tan(x) Diamonds: cot(tan(sin(i/x))) Concatenated cardioid curves: sin(i*cos(i/x)) Chaos: sin(i^cos(x))
you've got to zoom out pretty far for the effect to be apparent,. but r*theta = sin(theta^3) / cos(theta^3) is kinda interesting. as you zoom out, the spikes start to disappear tan(y) = -sin(x)^x makes seagulls (in +ve x anyway) y = sin(x^y) / sin(y^x) looks like rain on a lake
Saw all of the videos in these series and it inspired me to do some tries with Desmos, there are the two I liked the most: x^cosy = y^cosx and x(cosy^3)+y(cosx^3) =1 first one forms a really interesting waffle shape and the second one is just a mess!
The nice thing about `mod(x, m) < mod(y, m)` is that it's faster to compute than `sin(x) < cos(x)` but the pattern is not exactly the same, and you can control the size by changing the argument `m`. The `x^3 - xxx = 0` is probably due to floating-point rounding errors
i just stumbled across this, i’m so glad this exists! i used to do this stuff back in high school math class for fun! also i figured out how to make diagonal parabolas back then but i don’t remember how anymore, unfortunately, i would’ve loved to share
5:41 actually looks like this. I mean, the radius diverges more and more often as θ increases, so it eventually fills the plane if your graph-drawing pen has non-zero thickness.
I was tripping seeing the graphics and then... Opeth. Love that band man, and love people who loves that band. Here is my like for the video itself, and for your good taste
You are mostly correct. Here's one way to see this rigorously: If you perform the substitution u = x - y, the equation becomes u^3 = u + 2y y = (u^3 - u)/2, which does not have an asymptote along the line u=0, which would be the asymptote y=x in the original equation.
Very cool videos, all of 3 episodes. If you search for a funny spiral, tan( (x^2 + y^2)^(-1) ) = y/x. Otherwise, you can print a Mandelbrot set in Desmos: define f(z) = (z.x^2 - z.y^2 + x, 2z.xz.y + y) ; define D(z) = sqrt(z.x^2 + z.y^2) ; graph D(f(f(....f(f(((x,y))))....))) . IMPORTANT: keep 3 pair of parenthesis after last f, and the right dot or comma in the functions! More f you put, more precise Mandelbrot set is
ffffffffffffffffffffffffffffffffffffffffffffffffffffffffffffffffffffffffffffffffffffffffffffffffffffffffffffffffffffffffffffffffffffffffffffffffffffffffffffffffffffffffffffffffffffffffffffffffffffffffffffffffffffffffffffffffffffffff is it more precise now? edit: wow it is
When I was messing around with the trigonometry functions on a graphing calculator, I found an equation that forms a very cool looking graph. Equation: sqrt(cos(2x * pi^2 * sin(y^2))) = pi^2 * y^2/x
Next time you do one of these, try r=sqrt(theta). It's a normal spiral where each rotation get's closer and closer to the previous rotation. Also try increasing the upper limit. Do to Desmos' inaccuracy, it gets more and more angular as the upper limit increases. After 2500 is when the spiral starts to get angular, and at 100000 it becomes a really nice trianglular shape.
also, try (y^(x/y))/(x^(x/y))=(x^(y/x))/(y^(y/x)). The equation itself look completly insane, but's it's completly normal a straight line. I also did the math, and it checks out. That equation is just an overcomplicated way to write y=x.
I suggest 2 formulas in desmos terms: \gcd\left(x,y ight)=1 in human terms: gcd(x,y)=1 in desmos terms: \gcd\left(\operatorname{mod}\left(x,a ight),\operatorname{mod}\left(x,b ight) ight) in human terms: gcd(mod(x,a),mod(x,b)) depending on variables a and b.
I was messing around with a graph I made that counts in binary mod(x, 2^floor(y+1)) > 2^floor(y) However, removing the floor functions produces some really stunning results. You can also swap out the ">" sign with a "=" sign and it will retain its stunningness
If you’re still doing these I’ve found quite a few interesting graphs: cosx^2+cosy^2=cosxy (or tangent/ without the squares) sin((6+x^3)/xy)=cosy (Beautiful center, sides are madness) x^n= siny (repeated squares) y+x= abs(tany) x^30+y=tany (Beakers) sin(|x|+|y|)=cosy
my favourite is still sin^2(xy) = tan(xy), it is a repeating one as well and to get the most of it you have to scroll out a bit as well as to the side, the center is kinda boring sin^2(xy)=x^2e^-y^2 is also interesting, to make it single just take the square away of the y tan(y) = sin (x^2 y) as well - as it is mirrored on both axes it is kind of satisfying tan^2(y^2) = sin(xy) since people seem to like those bubbles edit: i just found some art tho, r = a + 2a * (cos(b*theta)+sin(b*theta)) a ={IR}, b = [1, 2] this makes clover leaves. i didnt find a formula to get any prediction on how many you get some are even appearing multiple times 1 leave b = 1 2 leaves b = 2 3 leaves b = 1.5 4 leaves b = 1.3 3 periodic 5 leaves b = 1.6 6 periodic 5 leaves b = 1.25 6 leaves b = 1.2 7 leaves b = 1.16 6 periodic 7 leaves b = 1.4 7 leaves b = 1.75 8 leaves b = 1.6 9 leaves b = 1.8 11 leaves b = 1.83 3 periodic actually i think thats all of the bs there is
yeah iirc you can make petal shaped flowers in polar with r = a + bcos(theta) or sin(theta) and the right ratio of coefficients of a to b. I don't remember off the top of my head but you can also make other shapes like limacons.
Desmos doesn't actually like Q3 the most, the bottom left of the screen just contains some form of rendering glitch/error/etc. In fact, if you move the graph around, the clump of more concentrated mess will remain in almost exactly the same place on the screen, so long as there is sufficient mess for it to be rendered.
What about tan(y)sin(xy)=sin(x)sin(xy) Stacked sin-like curves on top of a different graph. Try zooming out g(x,y)sin(xy)=f(x,y)sin(xy) works for any function g and f
6:13 i think it looks this way because theres e^x in the equation so above ~800 it exceeds the integer limit so cant show, in reality the graph would go on forever
This is my favourite one, i came up with this for fun. sum (bound very large ~100, n=1) of ((1/n^2)(cos(n^2 x))) as the boubd approaches infinity you get a non differentiable function symilar to the weistrass fxn
Got one I remember doing with my own messing around. sin(cos(tan(xy))) = sin(cos(tan(x))) + sin(cos(tan(y))) Rather broken but kinda pretty near the center. I think anyway.
variable and trig spam is fun with this Yamsox's base triangle equation: x^{2}+y^{2}=\sec^{2}\left(\operatorname{mod}\left(\arctan\left(y,x ight),\frac{2\pi}{n} ight)-\frac{\pi}{n} ight)
These have been interesting to put into my marching pixels (marching squares, but each square is a pixel) algorithm - Most of them are the same, though due to how the marching squares algorithm works there's no such thing as a non-enclosed shape so many of the graphs have lines connecting things that aren't connected in Desmos
you'd expect that sin(xy)/cos(xy) would get tan(xy) but desmos hates it when you submit "\frac{\sin\left(xy ight)}{\cos\left(xy ight)}=\tan\left(xy ight)"


This reminds me of getting bored and playing around with random functions in precalc class until I found something cool
122 likes and no replies? Lemme fix that
Is that pfp an interrobang? :O
Whenever my math teacher gives us something to do on desmos I do that too
i do that all the time
‽
This video is just... Perfect timing. Back to a year ago, i just found 'grape messy graph' video from japan from many many years ago. And this channel casually uploaded this video when i find more about it. Just perfect timing and i like it. Plus this video also included the equation suggested by your viewer.
So what
@@Andrewman That's really cool! Both of your channels are incredibly satisfying.
I‘ve got some other heartshaped curves for you:
1. A sort of sine wave that forms into a heart for a parameter a increasing. Let a >= 0, y = x^(2/3)+0.9*sqrt(3.3-x^2)*sin(a*Pi*x)
2. Defines a group of curves together forming a heart (best shown if you draw with it with a trace). Let a be [1,20], (sin(a*Pi/10)+x)^2+(cos(a*Pi/10)+y)^2 = 1+0.7*|x|*y
I hope I wrote it down correctly, if it doesn‘t work let me know! I would have some for 3D, but that‘s for another day…
What about x² - |x|y + y² ≤ 1
thats what it looks like in my eyes :/
@@nidhiagrawal3354 That‘s a simple but pretty one, I like it!
There's also (x² + y² - 1)³ - 3x² × y³ ≤ 0, definitely my favorite heart graph.
A=(10^11)+10^3
Glad to see there's a math equation for my stress graphs
Very cool.
Here are some interesting complex number functions. You'll need GeoGebra or something similar since Desmos can't understand imaginary numbers.
Lasers: sin(i*x)
Repeating circles: i^x
distorted grid: x^i
I can't think of anything: i*tan(x)
Diamonds: cot(tan(sin(i/x)))
Concatenated cardioid curves: sin(i*cos(i/x))
Chaos: sin(i^cos(x))
x^i^i^x = crash
x^i*i^x = an infinite quasar
log(z^sin(i*z)) 😰
i * tan(x) looks like a magnetic field
First part: 1 year ago
Second part: JUST YESTERDAY
Therapist : Desmos hamburger face isn't real, it can't hurt you.
Desmos hamburger face : 4:57
6:17 the farlands in minecraft
fr
you've got to zoom out pretty far for the effect to be apparent,. but r*theta = sin(theta^3) / cos(theta^3) is kinda interesting. as you zoom out, the spikes start to disappear
tan(y) = -sin(x)^x makes seagulls (in +ve x anyway)
y = sin(x^y) / sin(y^x) looks like rain on a lake
It get's even more interesting if you zoom in instead. It goes from stars in the sky to spiderweb
for the last one, you can use log{y}x = tan(xy), which makes it look close enough, with finer detail
Saw all of the videos in these series and it inspired me to do some tries with Desmos, there are the two I liked the most:
x^cosy = y^cosx
and
x(cosy^3)+y(cosx^3) =1
first one forms a really interesting waffle shape and the second one is just a mess!
I have a suggestion!
Sunlight year chart for the northern hemisphere (where x is the day of the year & y is the hour of the day)
Equation: y
Note: This equation only works for degrees.
Hi andrew, i think i have found an interesting graph, although it is a bit complex:
y=lcm( sin(x), lcm( x^y, sin(y^x)))
pretty cool thunder
what does it look like tho
The nice thing about `mod(x, m) < mod(y, m)` is that it's faster to compute than `sin(x) < cos(x)` but the pattern is not exactly the same, and you can control the size by changing the argument `m`.
The `x^3 - xxx = 0` is probably due to floating-point rounding errors
i just stumbled across this, i’m so glad this exists! i used to do this stuff back in high school math class for fun!
also i figured out how to make diagonal parabolas back then but i don’t remember how anymore, unfortunately, i would’ve loved to share
Iirc blackpenredpen made a video on rotating parabolas
Tiger
Add an xy term
It's amazing what an equation can do. I wonder if there's an equation that draws my face.
have you ever heard of bezier curves?
Probably a piecewise one
Depends on what is "your face"
2:26 looks a little bit like 🙋♂️🇩🇪
🇩🇪🇮🇹🇯🇵
art school man
5:41 actually looks like this. I mean, the radius diverges more and more often as θ increases, so it eventually fills the plane if your graph-drawing pen has non-zero thickness.
2:57 slight correction. n = -100
Hi Andrew, loving the videos. Could you tell us the names of the songs you're using? Especially the first one! Thanks so much :)
What? Keep it going, these are great graphs
6:30 - that you see if you look down from any tower in NYC
This was such an amazing one of a kind series!
0:50 danicker
3:10 audigamer
I was tripping seeing the graphics and then... Opeth. Love that band man, and love people who loves that band. Here is my like for the video itself, and for your good taste
Not first!
P.S. You should try plotting in Maxima!
the periodics functions are visualy really good, this channel is very interesting
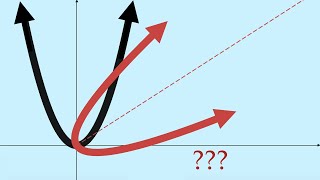
1:16 I don't think y = x is an asymptote. This graph is just a stretching and rotation of y = x^3.
You are mostly correct. Here's one way to see this rigorously:
If you perform the substitution u = x - y, the equation becomes
u^3 = u + 2y
y = (u^3 - u)/2,
which does not have an asymptote along the line u=0, which would be the asymptote y=x in the original equation.
Another one: Take the Riemann Zeta function and replace Zeta(s) with r, s with thêta and infinity with k.
Then you can try to tweak those numbers
0:50 the graphs in cursed desmos sounds be like:
Damn i love these graph videos.
Even though i have no idea how any of this math works.
its amazing how trig functions together can make such fascinating graphs. cos xy = sin(tan yx)
5:42 Anime RUclipsrs be like
0:37 Eren Yeager function
for x^3 - xxx = 0... Maybe it goes like this because of floating-point arithmetic?
And maybe many other graphs too
try x^2 = y^(50sin(x)sin(xln(y))) scale from -20 to 20
Omg I love your content! Keep doing this cool math thing
I think it's so weird when the equations and expressions generate an asymmetrical visualization.
Really awesome series. I hope you keep making more.
Very cool videos, all of 3 episodes. If you search for a funny spiral, tan( (x^2 + y^2)^(-1) ) = y/x. Otherwise, you can print a Mandelbrot set in Desmos: define f(z) = (z.x^2 - z.y^2 + x, 2z.xz.y + y) ; define D(z) = sqrt(z.x^2 + z.y^2) ; graph D(f(f(....f(f(((x,y))))....))) . IMPORTANT: keep 3 pair of parenthesis after last f, and the right dot or comma in the functions! More f you put, more precise Mandelbrot set is
ffffffffffffffffffffffffffffffffffffffffffffffffffffffffffffffffffffffffffffffffffffffffffffffffffffffffffffffffffffffffffffffffffffffffffffffffffffffffffffffffffffffffffffffffffffffffffffffffffffffffffffffffffffffffffffffffffffffff
is it more precise now?
edit: wow it is
When I was messing around with the trigonometry functions on a graphing calculator, I found an equation that forms a very cool looking graph.
Equation: sqrt(cos(2x * pi^2 * sin(y^2))) = pi^2 * y^2/x
Next time you do one of these, try r=sqrt(theta). It's a normal spiral where each rotation get's closer and closer to the previous rotation. Also try increasing the upper limit. Do to Desmos' inaccuracy, it gets more and more angular as the upper limit increases. After 2500 is when the spiral starts to get angular, and at 100000 it becomes a really nice trianglular shape.
also, try (y^(x/y))/(x^(x/y))=(x^(y/x))/(y^(y/x)). The equation itself look completly insane, but's it's completly normal a straight line. I also did the math, and it checks out. That equation is just an overcomplicated way to write y=x.
@@thatoriginalguy6213actually it's y=x [x≥0]
5:42 anime lines green screen function.
amazing and useful!
I suggest 2 formulas
in desmos terms:
\gcd\left(x,y
ight)=1
in human terms:
gcd(x,y)=1
in desmos terms:
\gcd\left(\operatorname{mod}\left(x,a
ight),\operatorname{mod}\left(x,b
ight)
ight)
in human terms:
gcd(mod(x,a),mod(x,b)) depending on variables a and b.
Suits perfectly with the moment, i am studying functions and this is cool, even if i don't understand sin(e)^x and stuff like this lol
1:50 I feel like the graph for (x^3)-(x*x*x)=0 is a computer science lesson in floating point numbers. Any time that y!=0 is a rounding error.
I was messing around with a graph I made that counts in binary
mod(x, 2^floor(y+1)) > 2^floor(y)
However, removing the floor functions produces some really stunning results. You can also swap out the ">" sign with a "=" sign and it will retain its stunningness
At 6:10, the graph that creates really reminds me of the Minecraft farlands.
1:07 love does exist in math.🥰
Yes it does but never long. You need an account for that
Please don't stop doing this videos!!!
imo csc is the most chaotic trig function
something like :
y=csc(xy)
sqrt(nx+y)
I twould be cool for the ones where desmos crashed and burns if you could give an approximation of what the graph would actually look like.
If you’re still doing these I’ve found quite a few interesting graphs:
cosx^2+cosy^2=cosxy (or tangent/ without the squares)
sin((6+x^3)/xy)=cosy (Beautiful center, sides are madness)
x^n= siny (repeated squares)
y+x= abs(tany)
x^30+y=tany (Beakers)
sin(|x|+|y|)=cosy
This equation contains fine detail that has not been fully resolved.
My favorite is r = θ×0.05
0≤θ≥10000
Zooming out makes it look like a galaxy
my favourite is still sin^2(xy) = tan(xy), it is a repeating one as well and to get the most of it you have to scroll out a bit as well as to the side, the center is kinda boring
sin^2(xy)=x^2e^-y^2 is also interesting, to make it single just take the square away of the y
tan(y) = sin (x^2 y) as well - as it is mirrored on both axes it is kind of satisfying
tan^2(y^2) = sin(xy) since people seem to like those bubbles
edit: i just found some art tho,
r = a + 2a * (cos(b*theta)+sin(b*theta)) a ={IR}, b = [1, 2]
this makes clover leaves. i didnt find a formula to get any prediction on how many you get
some are even appearing multiple times
1 leave b = 1
2 leaves b = 2
3 leaves b = 1.5
4 leaves b = 1.3 3 periodic
5 leaves b = 1.6 6 periodic
5 leaves b = 1.25
6 leaves b = 1.2
7 leaves b = 1.16 6 periodic
7 leaves b = 1.4
7 leaves b = 1.75
8 leaves b = 1.6
9 leaves b = 1.8
11 leaves b = 1.83 3 periodic
actually i think thats all of the bs there is
more bubbles
log(cos(ye!))=tan(sin(xπ!))
yeah iirc you can make petal shaped flowers in polar with r = a + bcos(theta) or sin(theta) and the right ratio of coefficients of a to b. I don't remember off the top of my head but you can also make other shapes like limacons.
Desmos doesn't actually like Q3 the most, the bottom left of the screen just contains some form of rendering glitch/error/etc. In fact, if you move the graph around, the clump of more concentrated mess will remain in almost exactly the same place on the screen, so long as there is sufficient mess for it to be rendered.
Damn this music goes hard. Love the combination!
sin(xy)=e^(xy) is funky squares
tan(x/y)=x is kind of a basketball
sin(y)+x=e^y - x^2 is dripping stuff
some of my trig experimentation:
x^2 - y^2 = csc(xy)
sin(x) - sin(y) = (x/y)
sin(|x|) = cos(xy)
sin(x^2) = sin(y^2)
x^2 = sin(xy)
sec(x) >= sec(y-pi)
What about tan(y)sin(xy)=sin(x)sin(xy)
Stacked sin-like curves on top of a different graph. Try zooming out
g(x,y)sin(xy)=f(x,y)sin(xy) works for any function g and f
6:13 i think it looks this way because theres e^x in the equation so above ~800 it exceeds the integer limit so cant show, in reality the graph would go on forever
0:55 my heart rate when something creaks at night
Desmos "why this guy hates me so much" 😂😂
0:43 my heartbeat when the
Nice, my graph got there :) The hamburger generator was really creative.
You could try to do some weird functions on a polar graph! I'm tired of the standard flower and ribbon patterns
a = coth(y! * x) + 1 / a > 1
lower axis gave some funky inverted spike graph.
5:44 doesn't have any inacuracies. If θ goes to infinity, the entire screen should fill.
This is my favourite one, i came up with this for fun.
sum (bound very large ~100, n=1) of ((1/n^2)(cos(n^2 x))) as the boubd approaches infinity you get a non differentiable function symilar to the weistrass fxn
You can zoom in very far and it is almost self similar
0'58 This graph is discontinuous.
|sin(x^2) * tan(y)|^cos(x) = y
This one is actually kinda creepy. Also, you should move a little out on the x axis to get the full experience
5:36 Geogebra seems to show this graph pretty well, and I can confirm it's a nice graph
I want to hear the funny sounds that come with the graphs
Got one I remember doing with my own messing around.
sin(cos(tan(xy))) = sin(cos(tan(x))) + sin(cos(tan(y)))
Rather broken but kinda pretty near the center. I think anyway.
log(x^2 +y)=cos(y-x^2) is quite weird. I call it “The Spikey Plant”
r=sin(cos(tan(cot(sec(csc(theta)))))) might be the most stunning polar equation I've ever seen. Just zoom in.
variable and trig spam is fun with this Yamsox's base triangle equation: x^{2}+y^{2}=\sec^{2}\left(\operatorname{mod}\left(\arctan\left(y,x
ight),\frac{2\pi}{n}
ight)-\frac{\pi}{n}
ight)
These have been interesting to put into my marching pixels (marching squares, but each square is a pixel) algorithm - Most of them are the same, though due to how the marching squares algorithm works there's no such thing as a non-enclosed shape so many of the graphs have lines connecting things that aren't connected in Desmos
I wouldn't call 3:52 trypophobia as the holes are arranged on a grid. Trypophobia is triggered by irregular arrangements of holes
I agree
Y = sin(x^cos(y)) is a simple yet fun equation
6:14 reminds me of the Minecraft Farlands so much!!
You know that checkerboard pattern? You can do some weird stuff to that. Such as:
sin(x)+sin(y)+0.5(sin(5x)+sin(5y))
if you put: sin(x)+sin(y)+0.5(sin(5x)+sin(5y))
sin(x^4)^y=100 - looks like raindrops falling when you're zooming in/out
Oh. Desmos doesnt like those? You know what time it is then? Its scratch time!
The thumbnail is my graph suggestion, nice
6:19 Minecraft farlands
How you take factorial with a negative argument? Is it Gamma-function? (Sorry for my English)
yes
tan(x\sin y)=(2\cos(y)^{2}-1)(1+\tan^{2}(x)) makes what I would call "sea creatures"
Are there more accurate graph plotters than desmos?
Can someone explain the x^3 - xxx?
MORE about math graphs, I like it
Graph ideas:
Level 1
x^2+y^2=y
Level 2
sec(x+y)=sec(x•y)
Such an amazing video! If you'll do more, here is an interesting one:
x^2+sin(x/e)*cos(y^2)=y
or this:
xy^tan(x)+tan(x^(tan(y)*csc(y))) = 2
Some cool textiles pattern: (sinx)^-3
2:13, greate! but you need one more bracket...
you'd expect that sin(xy)/cos(xy) would get tan(xy) but desmos hates it when you submit "\frac{\sin\left(xy
ight)}{\cos\left(xy
ight)}=\tan\left(xy
ight)"
r=sec(mod(θ!, 2π : n) - π : n / -2 < θ < -1 / n=0.2
this equation almost broke desmos and made my laptop heat up.
x^3 - xxx = 0 is only buggy because the graph applies everywhere.
y=gcd(tan x,cot x,sin x,csc) is a wierd ladder thingy and tan((y+0.5)!)=sec(x!)is like the tangent of a circle but cursed
Bro was just looking to see the crazy graphs people have discovered and OPETH COMES ON?? What a nice surprise!
not a disgusting graph, but a rather pretty one: r(θ)=2-3sin(8θ)