Think Cell GANTT CHART TUTORIAL | EVERYTHING You Need To Know

HTML-код
- Опубликовано: 11 июл 2024
- ✅ In this Think Cell Tutorial you will learn how to create a Think Cell Gantt Chart in PowerPoint and how to adjust the different elements as well as customize the chart layout based on you individual preferences.
With these simple, step-by-step instructions I will show you how to insert and customize a Gantt Chart in Think-Cell and you will get an overview of the different features and functionalities of such a project timeline.
By getting a general overview and mastering the different possibilities and settings of a Gantt Chart in Think Cell you will be able to quickly and effectively adjust your future project timelines based on your specific project needs and thus, save a lot of time and effort!
🚩 This course is split in 4 major parts and covers the most frequently asked questions about Think Cell Gantt Charts:
1. Introduction (00:00)
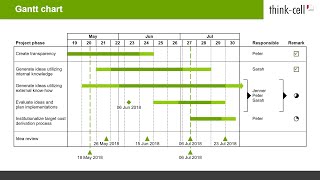
2. Insert a Think Cell Gantt Chart and Explain the different chart elements (00:28)
3. How to adjust the individual elements of a ThinkCell Gantt Chart such as date range, activities or milestones
- How to change the date range (01:38)
- How to adjust activity labels (04:14)
- How to insert or delete rows in the Gantt Chart in Think Cell (05:39)
- How to insert or delete row separators (06:48)
- How to adjust activity bars (08:52)
- How to add milestones in a Think Cell Gantt Chart (11:55)
- How to add other elements, i.e. process bars, shades, bracket (13:17)
- How to insert columns (15:06)
4. How to customize the layout of a Gantt Chart in Think Cell, i.e. adjust scales and insert or delete column separators (18:50)
- How to indicate dependencies (21:03)
▬▬▬▬▬▬▬▬▬▬▬▬▬▬▬▬▬▬▬▬▬▬▬▬▬▬▬▬▬▬▬▬
⚡️ If you do not have Think Cell such that you cannot create a Think Cell Gantt Chart you can check out this tutorial that will show you how to create a Gantt Chart in PowerPoint ► • How to Make a Gantt Ch...
🔥 Want more professional PowerPoint presentation tips, slide designs & techniques?
Subscribe ► / @presentationmastery
▬▬▬▬▬▬▬▬▬▬▬▬▬▬▬▬▬▬▬▬▬▬▬▬▬▬▬▬▬▬▬▬
MY FAVORITE OFFICE GEAR*
🖥️ My LG curved ultra-widescreen monitor: amzn.to/3ztOlkr
🐭 My Logitech wireless mouse MX Master: amzn.to/3Uao8jz
🎧 My Bose noise cancelling earphones: amzn.to/3UjbIWd
🔊 My Jabra speaker for video conferences: amzn.to/3fsyuMf
💻 My Lenovo Thinkpad X1 Carbon workhorse notebook: amzn.to/3WkevQE
🛋️ My BenQ ScreenBar: amzn.to/3WoUyIC
🆙 My height adjustable standing desk: amzn.to/3DxQBJ0
💡 My Philips Hue smart light bars: amzn.to/3TSX0W4
MY FAVORITE SOFTWARE/TOOLS*
📊 Microsoft 365: amzn.to/3zxnjcc
🔊 Where I listen to 30+ audio books per year: amzn.to/3gUOUgV
* Links are Affiliate links. This means I earn a small revenue share whenever a qualifying purchase is made via the link. The price for you stays the same = win/win 👍
#thinkcell #thinkcellganttchart #ganttchart


This video is underrated! Thanks for the amazing content and perfect explanation :)
Thank you so much, Laurent! Glad that I could help you out :)
very nice tutorial, also the speed and length is good. Long enough to learn something, but also fast enough to not get boring! Merci
Thanks for the feedback!
Thanks for the video! Could you, please, clarify how can i change the color of the week separator?
Good video
One question, is it possible to modify the dimensions of mileston symbols (Eg. Triangle)?
Hi, thanks for the helpful tutorial. Could you help me with the following? After making the gantt chart manually, adding all the items, I don't see the data in the imbedded excel sheet. I thought it's automatically filled in, or am I missing something? Thanks
lovely voice :)
Thanks for the video! I was wondering if there is any possibility to add also more columns on the left side or to move the "Responsible" / "Status" column to the left side of the chart.. Thanks in advance
Hi there! To my knowledge, it is unfortunately not possible to move the "responsible" / "status" column to the left and I also doubt, that you can add more columsn to the right. If you want to include more information you would probably have to insert a simple table or text boxes besides the ThinkCell chart. Hope that helps
Hi, Using think cell, while creating a Gantt chart, is it possible to provide links to the bars? The links could be external slide or external link.
Thanks for the video. Very nicely explained :-). I have a question: How do you add the current date (today date) top a chart? Thank you in advance!
Hi Anca, thanks for the nice feedback :) Unfortunately, you cannot add a date on top of the chart via a thinkcell function (if you still want to do it, you would need to use a simple PowerPoint text box). You can only add a date below the Gantt Chart with a respective line as of your specific date. See minute 14:25 where I insert such a milestone/time stamp that you can also pull to the right or left to the current date and label it respectively. Hope this helps!
@@PresentationMastery thank you for your feedback. I was wondering on the chart if it is possible to ad a line similar with the milestone one. 😊
Hi, I have Think Cell 28300 installed, I've tried to create a Gantt chart just like you did, but the scale "week" does not display the number of weeks, but rather shows the days per weeks (01, 08, 15, 22). Do you know if there's something I could configure to change that? Flawless explanation!
Hi Oscar, clicking on the "week" scale (it should be a right click) you should be able to also choose the display format of the weeks. Hope that helps
Hey, Nice video.
can you please teach me how to display delay in schedule using this tool?.
Hi, Did you get an answer to your question? I am trying to do the same thing.
Is there a way to show movement when activities/milestones move?
Is there a way to change the Text Box colour of Milestones? It seems only if the milestone is within the Date specified by the Bar the colour will adapt, otherwise the text box will be white.... This is a bit of a nightmare for readability.... especially when there are many columns in my gantt
what should I do if I have may activities and not fit for just 1 page ?
I request you make videos on each type of chart available in the think-cell
How to add progress % in the Gantt chart?