Hello there! This is a property of Weibull Distribution. You may like to watch my videos on Weibull Distribution. Links shown below: Weibull Distribution Part-1 ruclips.net/video/dxwlYZ-8_GM/видео.html Weibull Distribution Part-2 ruclips.net/video/WbG5Z7irUu4/видео.html
In this example, we are sure about all the raw data are operation time of failure, right? Another question: Isn't a smaller Anderson-Darling value indicative of a better goodness-of-fit? Why is the Weibull distribution considered the most appropriate when the exponential distribution has the smallest value?
Hello friend, that is a very good question! Yes, the lower value of AD shows better fit. Choosing Weibull is still safe as Exponential is only a special case of Weibull with a shape parameter of 1.
I am not sure why Minitab does this often. However, Exponential is only a special case of Weibull Distribution with a shape parameter of 1. So if you select Weibull, Exponential will get included, if it fits.
Sir, I'm trying to draw two data sets weibull plot . I have calculated the shape and scale parameter for both. But i can only define the first data set's parameters. There is no area for defining second data set's parameters. Could you please help me? Thank you...
The correlation coefficient indicates whether the ln of time and the y-axis function have adequately strong relationship which can be used to make estimates.
@@instituteofqualityandrelia7902 @Institute of Quality and Reliability thank you sir for your respon, i apreciated. But, how about exponential distribution ? exponential distribution don't has pearson coefficient correlation because the distribution is unvariate.
@@mfroo-vq4of The probability plotting is a generic concept. And for example, in exponential distribution, R(t)=exp(-lambda x t). Taking logarithms, ln (R(t))= -lambda x t. Thus x axis is time t and y axis is Reliability (log scale). The correlation coefficient would shows whether the two have a linear relationship. If it is linear, it will be indicated by the correlation coefficient. Hope this helps.
The value of scale parameter is a mathematical property as shown in one of our video on Weibull Distribution Part-1. Link is here: ruclips.net/video/dxwlYZ-8_GM/видео.html. We recommend that you watch this video to get explanation to your question. Good luck! ..Hemant


![Twenty One Pilots - “The Line” (from Arcane Season 2) [Official Music Video]](http://i.ytimg.com/vi/E2Rj2gQAyPA/mqdefault.jpg)


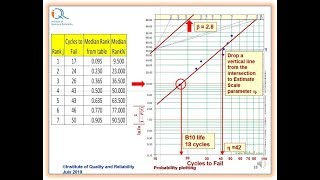
Good morning sir, How you saying 63% product will fail. where it is mentioned? can you pls explain..
Hello there! This is a property of Weibull Distribution. You may like to watch my videos on Weibull Distribution. Links shown below:
Weibull Distribution Part-1 ruclips.net/video/dxwlYZ-8_GM/видео.html
Weibull Distribution Part-2 ruclips.net/video/WbG5Z7irUu4/видео.html
please sur i want to know how can i download minitab software !!
You can download the free 30-day trial version from minitab.com.
Awesome !!! Thanks Sir.
Most welcome! I am glad to know!
In this example, we are sure about all the raw data are operation time of failure, right? Another question: Isn't a smaller Anderson-Darling value indicative of a better goodness-of-fit? Why is the Weibull distribution considered the most appropriate when the exponential distribution has the smallest value?
Hello friend, that is a very good question! Yes, the lower value of AD shows better fit. Choosing Weibull is still safe as Exponential is only a special case of Weibull with a shape parameter of 1.
Thank you very much sir
My pleasure! Welcome!
Sir, why exponential coefisien correlation always *?
I am not sure why Minitab does this often. However, Exponential is only a special case of Weibull Distribution with a shape parameter of 1. So if you select Weibull, Exponential will get included, if it fits.
Sir, I'm trying to draw two data sets weibull plot . I have calculated the shape and scale parameter for both. But i can only define the first data set's parameters. There is no area for defining second data set's parameters. Could you please help me? Thank you...
Thanks. But I have not understood your question. If you wish, please send mail to me on hemant@world-class-quality.com.
what is meant by occurrence of event? how can we find out "occurrence of the event" from weibull using minitab?
Occurrence of event can be failure in this context. Ini the analysis, our intention is to determine probability of failure free performance.
excuse me sir, can you explain why you use correlation coefficient in this method?
The correlation coefficient indicates whether the ln of time and the y-axis function have adequately strong relationship which can be used to make estimates.
@@instituteofqualityandrelia7902 @Institute of Quality and Reliability thank you sir for your respon, i apreciated. But, how about exponential distribution ? exponential distribution don't has pearson coefficient correlation because the distribution is unvariate.
@@mfroo-vq4of The probability plotting is a generic concept. And for example, in exponential distribution, R(t)=exp(-lambda x t). Taking logarithms, ln (R(t))= -lambda x t. Thus x axis is time t and y axis is Reliability (log scale). The correlation coefficient would shows whether the two have a linear relationship. If it is linear, it will be indicated by the correlation coefficient. Hope this helps.
@@instituteofqualityandrelia7902 ok sir, thank you for your explanation.
sir can u share the data that is used for minitab software?
You can download the XL data files. This is in the file 'Reliability Data'. Download it from www.world-class-quality.com/downloads.
Hello Sir,
As you mentioned that scale parameter is 1281.31, 63 % parts will fail. what does that mean? why 63% ?
The value of scale parameter is a mathematical property as shown in one of our video on Weibull Distribution Part-1. Link is here: ruclips.net/video/dxwlYZ-8_GM/видео.html. We recommend that you watch this video to get explanation to your question.
Good luck! ..Hemant
Sir pls give comment on the data that you have used in this problem
This is a complete data from an application example. What exactly are you looking for?
Sir please can you send me the file
Om pure white House
Thank you professor!
Best regards..Hemant