It is good news. It further supports the conclusion that something needs to be done, in a much more visually striking way, and so makes it much harder for deniers to keep denying reality. If this news hadn't come out, the deniers would stand on slightly less shaky ground. Now they're wobbling really bad, and the onlookers will be noticing. There's not much room left for deniers to look like reasonable people, and so the numbers of deniers will decline further. I say that because I also used to deny the human contribution to global warming. At some point that denial becomes too absurd in the face of the evidence.
@@ETBrooD hey good on you for accepting human-induced climate change, even if it is something thats really awful to have to accept. i agree with the rest of your comment as well. the more proof we have of climate change, the more people will believe that its real, the higher the demand to do something about it
@@ETBrooD Nope. It only proves the fact the alarmists still want to explain the 5 billon years old history of earths climate by just looking at the past 200 years. Which is totally stupid.
Three things we do know about the MWP is that there were three crop rotations a year, vineyards thrived from Scotland to Cornwall, and the skeletons of the period indicate that even the very poorest people were eating exceptionally well in contrast to evidence from skeletons before and after that period. Historical records also state the poor were able to live comfortably outside in rough shelters and evidence of ancient houses that still stand today show us clues that it was a very warm period indeed. Well I not sure about the rest of the world, but certainly in Northern Europe the temperature was certainly significantly higher in the MWP than today for those factors to occur. Try growing vineyards in Scotland today or achieving three crop rotations per year and see how far you get.
We also know that 6000 years ago the Arctic was free of sea ice. Regional? There are 2 castles, I believe, that were built around 1200 AD with ocean docks. Those docks are now very far from the ocean because sea level was much higher in 1200 AD. Regional? THe Sahara was green 7000 years ago. Regional? If you take a bunch of proxies and average them out, won't their own lack of resolution cancel eachother out? Seems like you could make any data into a hockey stick that way.
@@johnkosowski3321 "If you take a bunch of proxies and average them out, won't their own lack of resolution cancel each other out?" Yes, that is very much what happens. And is how Mann got his hockey "stick" to be so straight.
Stop being silly. These mischievous manufactured contrarian narratives comprising of half truths, outright nonsense, fallacious arguments and irrelevant talking points are getting old and tired now. Boring in fact. It's hilarious how the AGW contrarian style has evolved from the full head on beligerence model, to instead relatively recently, trying to sound knowledgeable, resonable and considered as if they know anything remotely useful about the topic. Yep, you all look like sealions to me.
@@jamesfairmind2247 Recent rapid global warming is NOT the result of "natural cycles". Both long term Milankovitch and recent solar changes should have caused slight cooling over the last fifty years or so, NOT the observed rapid warming.
The use of tree rings as a proxy for temperature is problematic because tree ring widths are more influenced by the regularity of rainfall not temperature.
all proxies are problematic; tree rings are more effective as proxies in some regions than in others, and this is also why multiple proxies are used - as explained in the video.
@@Sa1d1n Tree ring growth is effected by the regularity of rainfall and sunlight. So large rings are produced in hot and cold years. Small rings are produced in hot and cold years. Where in the world are these basic facts not true? Were the samples taken for the analysis from only those locations? What and where is the proof of that? Also the vast majority of the analysis is based on tree rings making the other proxies used rather irrelevant. If you are going to use a proxy you need to use it throughout time not just to fill in for missing data.
@@Camerondes21 depending on tree species and location, tree rings may be predominantly rainfall-limiting or temperature-limiting. This helps you determine (with reasonable accuracy) what the contributing factor to the growth pattern is. Of course, this works better in some areas than others. This is why you use other proxies (e.g. Isotope analysis) to interrogate the rainfall and/or temperature patterns for the particular region and the particular time period under investigation.
Tree ring widths are caused by si light and rain fall. Which are caused by temperature differences. Huh? The temperature of the earth affects sunlight? That’s backwards.
So after doing some reading the scientists don't just use Tree Rings, they also follow it up with other proxies: - Chemical properties of fossilized remains of plankton and microbes in sediments where the age is known from radiocarbon dating - Ice drilled from polar regions - Stalagmites in caves - Sediment cores - Sediment laminations, or layers, can indicate sedimentation rate through time
Despite being predominantly recorded in Europe, south-western North America and in some tropical regions, the Medieval warm period affected both the northern and southern hemispheres. But the temperature increase was not universal, varying across regions of the world, and did not happen simultaneously everywhere.
@@paulsnow In the Roman warm periods Julius Caesar wrote about the fine wines coming from England some of which came from as far north as Carlisle, It is only now that wine is being made again in the UK and that is only in the south.
"Mediaeval warm period" is really short localised warm periods that are not simultaneous, but spread across about 500 years. It's an artifact of deliberate sampling bias.
@@paulsnow If I collect population height data from 3 different countries, the raw data is useless: Country A measurements are done in inches, Country B is done in cm, and Country C is done in cm using rulers that are known to have expanded due to the heat. The data first has to be homogenised so it is all equivalent. Scientists know this. Dimwit dropouts don't know this.
Excellent explanation - I love the monkey analogy! It's amazing how a 20 year old graph is still so relevant today. Also yes please for a climate-gate video - it's a conspiracy theory which refuses to die!
@@craigscott2315 the moon is flat and When the sun was eaten by a dinosaur 5000 years ago, an apple exploded. Also, red is my favorite color in the alphabet, from a chart from 1-10. The universe was debunked in the faked moonlanding in the century of pears, more exactly on the date black holes. Mind the monkey! In China, a bag of rice just tilted over, and my only infinite amount of toes just cried. Now my phone is sleeping. My RUclips-Channel died yesterday and I was just to it’s funeral. REFERENCES/SOURCES: 1. logic 2. common knowledge and common sense 3. J.F. Kennedy 4. T-Rex Happy easter!
@@craigscott2315 global warming hadn’t even really started in 1886 since temperature measurements first started about 6 years before that! And how do you debunk the temperature of the coming century, a century earlier?
Reports actually point out that the data varies, and so long as you point out that variance in the paper, it doesn't invalidate the data. Interesting little twist to scientific papers isn't it? Sort of like when I declare I became a millionaire on social media pages a few years ago, but realize it is because I stopped using Euros as a valuation and instead started counting my net worth in Pesos right about that time. Hrm. Most remote weather collecting data stations from rural or remote locations (which tend to have more stable temperature ranges over time) have been deprecated (removed or no longer included in date) over the decades. And those in urban locales e.g. major metropolitan cities (which have more consistently warming temp changes) have increased many fold. This is also pointed out in the paper as to why there is a warming trend. but...CO2!! CO2!! CO2!! It's now getting in the eggs! So feed your kids breakfast cereal! It's healthy for them!!! So sayeth the main stream media and your government....so let it be done. Amen.
These climate alarmists have many ways to lie with statistics. CO2 levels have increased by only 1.29 parts per 10,000 since 1880. Tiny! Insignificant! Nothing cannot cause something. That's how you realize that CO2 climate change is a big lie.
In a fairly publicized lawsuit, Michael Mann REFUSED to hand over the data for the hockey stick chart to prove his side. Mann lost the lawsuit. You should hold anything he trots out with a high degree of suspicion.
I hold out with a great degree of suspicion anything that confirms the narrative you have almost no choice but to confirm. If any climate scientist went against it even a little, they would likely lose their livelihood. Follow the incentives. It makes it almost impossible to understand any other climate stuff, because both sides seem out of their minds.
Can you provide a source for where Michael Mann refused to hand over data because I here that the controversy came from people analysing the same data and coming up with a different graph?
@@notacommie7154 If you had actually read the experiments and studies done in the last 20 years or so, you'd know how utterly foolish you sound. There is a lot of interest in what is going on, and only very specific areas have higher degrees of certainty. There is still a LOT to learn. The problem isn't the scientists.. it is politicians + agenda driven media supporting those politicians. You'll never find any time when all scientists agreed, and there has never been a time when there were not dishonest scientists. Why should today look any different?
What about the Roman Warm Period? I believe the RWP was even warmer than present day temperatures. Using tree rings to determine global temperatures is ridiculous. Drought years are small, wet years are bigger. Once while cutting firewood on my property, I counted back on the tree rings to the winter of 1968-69 - it was very big because that was an extremely wet year - and it was a cooler than usual winter. And good luck finding trees going back to the RWP.
@@lrvogt1257 From what I’ve read the RWP was more global than the MWP. Both periods had temperatures as warm or warmer for periods of time. The main takeaway with climate science is the constant, often erratic, change - even when humans can’t be blamed. The Russian and Japanese climate models are reaching far different conclusions than the models our government is using. The fact that trillions of dollars are at stake with this climate warming issue and the fact that our present government is corrupt to the bone makes me wish I could find another planet. The fewer humans, the better.
The problem with the hockey stick graph is that it stops using the tree ring data at about a century ago because the hockey stick doesn't show up in it.
There's multiple problems with that graph starting with the time frame it covers considering the Earth is billions of year's old. Humans really have no business talking about what's normal climate patterns for Earth when they know so little. The fact is Humans are a part of the ecosystem & its humans job to focus on human preservation. The Earth doesn't need humans because it does what it wants. People that have traveled in a plane & looked out the window can see how minuscule the effect humans have on Earth. What we are dealing with is phycological manipulation on a massive scale. Its not new because in ancient times they'd cut off peoples heads in hopes it would please the Gods & bring them rain. The Global Warming/Climate Change crowd are a cult. If you want to know the limits of human ability on Earth just go research Wars. If humans could have any influence on the Climate they would have already weaponized it.
@@wandameadows5736 What if we do nothing and then we have a better understanding later on then realize it's too late. What if we do something and head towards a cleaner more sustainable future. I know which one I would pick. You yourself state that we don't know if we are having an impact on the climate. I'm unclear on how you are able to state that climate change crowd is just a cult following. Your statements are contradictory at best.
@@wandameadows5736 So, your comment lacks in multiple ways. First of, abnormalities like a sudden consistent spike of global temperature is a good reason to question and analyze the whys. With regards to this issue, the industrialization and the consequent emission of greenhouse gases has proven to be an overall coherent theory. In contrast the theories of climate change deniers, which dont explain this occurence at all, it has managed to connect results from a vast amount of different research areas (such as mentioned in this video) while persisting. Secondly you can very much see human impact from a plane, such as the shaping of land into parcells. Thirdly, influence doesnt translate into control by default. Just because you can have an effect on something doesnt mean you have a way to turn it into a tool for your own use. But projects are working on WEATHER control (not CLIMATE), that i can assure you off. No proof cause really you google weather manipulation research and you find something Finally, do you believe factory and car exhaust fumes just vanish into non existence? Habe you ever fancied taking a good sniff from your exhaust pipe? No? Well, perhaps that is because it is indeed a form of so called pollution which is harmful to our species and others. But sure its easier to ignore reality when it doesnt suit us, so we can comfort ourselves into keeping our established habits, avoiding burdening our conscience. Blame it on a scheme and off the hook you are.
So, what was the global climate like between the glacial maximums? What was the global climate at the last glacial minimum (what we are currently heading towards or at)? How does maximum and minimum glacial loading effect the Earth's climate?
Michael Mann put up this fraudulent graph to get his Ph.D. I know my PhD thesis is not any better, we all cheat to get degree, but at least I stop talking about my fraud after I got my PhD.
@@dallasguy236 and sea levels in the Eemain interglacial 125,000 years ago, yes only 2-3°F warmer than the late 20th century temperatures, caused sea levels be 6 meters higher than today.
As soon as he said they used "scientific modelling" I shook my head. The academic Prof Ferguson who created the infamous Imperial College model that warned Boris Johnson that, without an immediate lockdown, the coronavirus would cause 500,000 deaths and swamp the National Health Service - Never happened. Ferguson was behind the disputed model that sparked the mass culling of eleven million sheep and cattle during the 2001 outbreak of foot-and-mouth disease and predicted 150,00 deaths from mad cow disease by 2080 - Never happened only 177 people have died. In 2005, Ferguson's model predicted that up to 150 million people could be killed from bird flu. In the end, only 282 people died worldwide from the disease between 2003 and 2009. In 2009, a government estimate, based on Ferguson’s advice, said a “reasonable worst-case scenario” was that the swine flu would lead to 65,000 British deaths. In the end, swine flu killed 457 people in the U.K. Many of these scientists would be better off playing with model trains than "modelling" predictions that vastly over estimate what they want to predict
@@incelshateme If it's just the one scientist, when his mistakes are so well documented that I heard about them *last year in Texas,* the real problems are the people who keep paying him.
What it missed was that the surface water temperature measurements based on NOAH data are wrong. Almost 90% of their measurement devices are in ultra close proximity to industrial wase outflow areas where the surface water temperature is almost 3X as high as the normal surface temperature that is not located within the bounds of industrial outflow. Ergo, the data is artificially high which skews the data into massively high values.
There are no “industrial waste outflow areas” where we monitored the highest surface temps in the Gulf of Mexico this year. As predicted, such temps caused massive hurricanes. Now Western North Carolina is destroyed and Central Florida is flooded. Happy now?
There is an obvious problem with splicing two different data sets together. If I draw a graph of last week's weather with data from the weather service, then add measurements using a thermometer which I check every hour, there will be something a kin to Michael Mann's hockey stick. Relative flat for 7 days then major fluctuations.
I'm an undergrad math student but I haven't taken any stats courses yet. Take what I say with a grain of salt. While we would see major fluctuations with more constant and steady measurements, we would not see these fluctuations occurring only in the same direction. Using your example, we would see that we would get spikes during the day time specifically during the afternoon when it is hottest but we would also see valleys during the night when it is coolest. These, of course, would not be detected by the weather service data (if you only use daily averages) and thus the weather service data would result in the "stick" in the hockey stick. However, measuring by the hour would result in data with peaks and valleys around midday and midnight respectively. This would not result in a hockey stick shape but rather just a more spiky/sporadic straight line. The only way we get a hockey stick shape (without the average daily temperature increasing) is if you only measured using your thermometer from the start of the day until it reaches peak temperature for only 1 day. Of course, this is bad form and is very similar to just cherry picking data as well as suffering from a small sample size (only 1 day). Now, I haven't read the study from which the hockey stick graph comes from, but I don't think it would've gotten published or received all the attention it received from the scientific community if it was using cherry picked data.
@@liambenoit5327 Those are some good comments, with the following being noted: Yes, the point the person is trying to make is that it is easy to cherry-pick and manipulate data to get a desired outcome. He doesn't really mean that his scenario is accurate. Second, I think you over estimate the academic acceptance of that particular hockey stick; the 97% agreement argument has been debunked many times. Third, what would be signs that academics might attempt to validate their desired outcome? You go back to past data and "adjust" them to strengthen your argument. Done. You also keep moving the goal post for your predictions to incorporate ever more actual data to minimize the effect of future variation and you make "improvements" to the model. Done. If we keep making "improvements" to models, that means that past models were flawed. And it also probably means that the whole model continues to be flawed. When do you stop and say that your model is THE one that makes the correct predictions? Third, you underappreciate the effect of funding to bias academics. These people's livelihoods are tied to bringing in federal and public-sphere grants and funding. Why would they show results that counter their paychecks? The other awful result is the bias in selecting research to be published. I've encountered this in my own publications. Journals are biased to select research that confirms current trends and methods, but not research that would result in, essentially, no hypothesis conclusion except to say they don't observe the same results and point out flaws of current research.
The elephant in the room is increased solar radiation. The evidence exists that the sun has made very great impacts upon earth's temperatures. It would be good to see a chart on that.
not really at all, solar radiation and cycles are, in cosmic terms, incredibly consistent and predictable, and have been shown over and over again to have next to no effect on Earth's climate in any way that can be clearly measured. or.... unless you're not actually asking/wondering, and are instead speaking in bad faith and are just hell bent on refusing easily observable fact... admittedly I have a hard time telling the difference sometimes
@@davelowe1977 of course the sun is the source of energy but it has been very consistent. It has even decreased in strength somewhat as the temperature rose. The 50% increase in co2 traps more of the suns energy so THAT is the cause of this global warming.
The Hockey stick graph shows two different kinds of data. There are modern thermometer readings with high accuracy, regular and frequent records and good geographical coverage. Then there are proxies which are the opposite. The proxy data is easy to find via PAGES12K (the metadata spreadsheet) and graphing up any dozen of the 1300 proxies will show huge variability even for the same places using similar methods. The graph you are shown is just lots of estimates added together. The likely +/- indicates a warm era like ours would be expected every few centuries. The IPCC best estimate for human warming is currently 1.07C. However the first 0.5C is just a return to normal after the Little Ice Age. So we are all supposed to panic over 0.6C above normal after 150 years. The obvious conclusion is that we are having a small effect on something that isn't that big in the first place. It might be a problem if we don't change for a few centuries but there is no reason to assume any crisis is going to happen.
What made it a conspiracy is their active refusal to provide access to their data, and when they did provide data, it was clear they had intentionally altered the datasets. Yes, "cleaning" data is a thing and can be valid, because some data can be in error or is spoiled in various ways, but they actively opposed investigating this. Yes, you also release the bad data and explain why it is bad, you don't hide it and lie about it. Their unscientific behavior rightfully led to questioning the validity of the graph. Note that nothing I said discussed the validity of the graph itself, just the bad behavior of Mann and Company was a strong driver of the controversy. Good scientists don't refuse to release full datasets.
And they cherry picked data and papers. They claimed the majority of papers say humans were a cause, but the reality is they excluded papers thst didn't mention humans, and so few papers explicitly said humans were not a cause. The great majority of papers on causes of climate change didn't mention humans because humans aren't relevant to it. So it's a subset of a subset where they rules put the majority.
You're wrong in the most important part: it's a completely fraud just like this video. I love how youtube push anti science ideological videos like this pretending to be controversial that shine new light but in the end it is just repeating the mainstream lies.
"Good scientists don't refuse to release full datasets.".... I wouldn't have released my data to some of the groups that were demanding it be released at that time. Some of them were the epitome of 'thinktank' (even as a teenager I wondered about the scientific rigor or lack thereof of some of them). My memory is of the scientists email being hacked, and their discussions about cleaning the data being used to call them crooks. They were damned if they did, and damned if they didn't.
I attended a lecture over ten years ago where the speaker stated several scientists went back to where the ‘hockey stick blade’ started to go up. From that point forward they ignored thermometers and continued using tree ring data as had been done at the start of the ‘Hockey Stick graph. From what we were told the tree ring data continued forward on basically the same ‘level’ as the earlier data. No up tick was found. Comments as to this?
This would be a part of the Climate Gate video, so I am hoping that Simon will be bringing this up. But as someone familiar with the science and those specific studies I'll comment on this. Direct temperature measurements are really accurate, right? We have been using them reliably pretty much from their inventions. Whenever we use alternate measurement methods they are always calibrated using direct methods, as is the case with tree ring proxies as well. So if at first direct measurement and tree-ring measurements (note that a lot more than just tree-rings were used as proxies, it is only one of the methods that were used) start to diverge, what do we do? Before the divergence the tree ring data agreed with direct measurements AND other proxies, after 1960 it went completely it's own way. So we are forced to conclude that something changed past 1960 that altered the way trees behaved during their growth seasons, causing them to skip sometimes even several growth seasons in certain areas. The most likely candidate for this is the heavy amount of aerosols that our industry used to push into the atmosphere before those emissions were curbed. Relevant studies for this: Briffa et al. 1998, MBH 1999, D'Arrigo et al. 2008.
@@Stratosarge I have to take exception that a single graph contains both proxy and direct measurement data, where proxy data is cut off at a certain point, assuming that modern data is simply superior. Temperature instruments have their problems also, such as calibration, placement, proximity to heat sources or urban areas, poor maintenance, operator error, transcription error or fraud (can happen with proxy data too), etc. I’ve worked with enough instruments that I am quite familiar with their potential problems. The graph should include modern proxy data as well, which would show there is some other effect occurring. This would hopefully inspire others to investigate the discrepancy and explain the gaps.
@@kensurrency2564 But the discrepancy and the gaps are well documented and the dendroclimatology studies show the complete proxy data. And because all the other proxies support the instrument data, either all the other proxies along with instrumental data that is used to calibrate even the tree-ring proxy is flawed, or the tree-ring data past 1960 is flawed. And note that the tree-ring divergence problem really happens in arctic circle trees, not globally. So the proxy data would not have been representative of the modern warming and thus it was correct to not include it in a graph that is supposed to represent the changes in climate for past 2 thousand years. All the data and the reasons for the omission are all explained in the studies, so there is no secrecy behind it either. And your points about all the systematic and non-systematic errors on instrumental data are also something that have been thoroughly considered. The data quality control has gone through peer-review and you can check the relevant studies on GISS data FAQ. And of course if someone comes up with a better quality control, they are free to submit their methods for peer-review.
@@pauljackson2409 "Just because we don't know everything, we don't know anything" is a common science denialist mantra, be it flat earther, creationist or climate denial. Yes, I am asking you to take the model on as much "faith" as I am asking you to take it on "faith" that 1 litre of water weighs 1 kilogram, even if only 24 out of 25 scales agree with it. The instrumental data, the other proxies and the tree-ring data on everywhere else besides certain locations within the polar circle agree with each other. And you are asking us to dismiss the rest because one dataset happens to be different in a situation where there are numerous reasons why it would be different. So you are being dishonestly obtuse. As to why it happens, tracking down the exact reason is impossible, but there are several plausible explanations like aerosol pollution, draughts and physical stress from the rapid warming during growth seasons. (Büntgen 2021, D'arrigo 2008)
@@pauljackson2409 Jones and Mann did not "delete data", they explained the whole thing in their studies. UK Institute of Physics did not criticize them on those studies, all the audits and future studies agreed with them. The criticism came from not cooperating with McKintyre, who was constantly pestering the CRU team. "If as you say, that deletion was justified because of other evidence, why weren't they transparent about why they did it?" They were transparent in the relevant studies. And again independent research teams from across the globe have confirmed their findings. "I hold a science degree and I believe in the scientific method." Then you seem to understand philosophy of science very poorly if you are expecting perfection in any field. Do you also dismiss theory of evolution because we don't have the full fossil record? There is always more to learn. Your whole grasping of straws and willful ignorance and intentional obtuseness comes across as childish, and very deserving of the science denier moniker. "But if you are trying to claim that something , you don'y know what, invalidates part of your data set, but not the rest of it, then that sounds to me like special pleading, and is anti-science." It would, if it wasn't for the rest of the evidence supporting the rest of the data-set. "who's to say that this didn't also happen in the Medieval Warm period?" If we did not have the rest of the proxies available you would be right. It is the exact same thing with radiometric dating, if we only had one method of dating available we would not be able to use it, as it would be constantly giving us false dates. That is why we have converging evidence from multiple methods from which we can figure out the correct method and age range, and then we can pinpoint the actual age of the dated sample. So if you truly have a degree, I truly worry how poorly the philosophy of science is taught as part of that education.
One thing I would've liked to see your analysis on is the error bars for the new graph. Is the data from 24k - 1000 years ago carrying the same error "level" as the previous graph did for 1k - 400 years ago? is it worse? better? And by how much has the error shrunk in that second period now. How much more confidence do we have?
I mean you can litterally see the error bars... And furthermore you can´t tell in figures "how much more confidence we have", through different methods you get different results, but you can say that the methods get refined everytime. It isn´t like science is frozen in biology or other fields of study. So you can say that newer results (if they are well peer reviewed) are "better" than older results with older methods.
@@fable4315 I think you misunderstood my question. I have no doubt that the error is smaller and that the newer data is more accurate. And yes I can estimate the error bars, but as the scales on the old graph and the new graph are completely different, I can't really compare them on my screen. Hence why I said it would be helpful to know a bit more detail about the comparison between the two.
@@fable4315 Ah i see what you mean now. Yes, that does show it visually, but I guess what I'm saying is, I'm science literate, I have a masters in Engineering, but lots of folks can't/won't take the time to understand these papers, so an explanation of the difference in error (both quantitatively and qualitatively, for the study) would've been useful, I think. Thank you for your help!
I must have missed something. Was proxy data validated with a new way of handling proxy data with credentials amounting to being 7 years in the processing? The end of the 25,000 year graph definitely had a vertical anomaly that has global warming possibilities but as a one step at a time person all it said to me was that what went before was indirect proxy temperature related data and what came after had direct temperature readings. In the 1960s met forecasters made serious judgements based on limited information,training and experience and the, now defunct, Bracknell met computer was being built. Now we are given a limited, but more reliable, choice of different computed models from a overload of data. It was towards the end of the 20th century that flights over the Atlantic stopped routinely passing met information in position reports and only did so as instructed to stop providing more data than was necessary. The biggest change to weather in the last 60 years is how humans can observe it. Adjectives like INCREDIBLE are for journalists not researchers who cannot live long enough to achieve results that will exclude inconvenient possibilities.
I can see why you'd think this, but a more accurate reading of temperature doesn't change the temperature you read, just the decimals after the point. And there WERE accurate ways of recording temperature in the past (see: trade ships in colonial times with thermometers travelling the world and recording temperature) It's just that the temperatures we are recording have gone up. According to your explanation we have somehow managed to significantly improve temperature recording methods, and at this trend, we can control global temperatures by getting better at recording them. If we want a colder Earth, just be less accurate? Unfortunately, like all things, it's not that simple. That "end of the graph anomaly" looks like an anomaly that should be ignored when you zoom out to a 25,000 year scale, but when you zoom in to ~500 years you see it's a massive, constant, accelerating rise that shows no signs of stopping and exactly follows greenhouse gas emissions. We also know that humans weren't really impacting emissions pre-indistrial revolution, due to the fact that the industrial machines hadn't even been invented yet, so they couldn't be making the emissions (since they didn't exist). Truth be told, I think your viewpoint is a good one to have that more people should use, but you also need to look closer if you want to apply it, and in this situation... You just can't. If you don't trust the dozens of credible temperature proxy recordings dating back thousands of years, you can say that, but the majority of the scientific community accepts that there is no better way to try and start recording an unrecorded past (apart from time travel, lol) Have a great day!
@@ThatOneGoatGuy Thanks for the reply. My point was that we now have masses of temperature recordings of recorded material at recorded times. The temperatures constructed from 25000 years ago reply on deductions from what is believed to be the consequences of conditions that have ceased to exist. It shows overconfidence to believe that the graph starts and ends with the same kind of data just because it is labelled temperature. In 1966 the senior forecaster at an airfield with a 200 feet cloud base briefed the assembled aircrew that it would clear by 1000 hours. The user audience laughed where upon the forecaster pulled out a 10 bob note and called "any takers"; the result was silence. The cloud base was still 200 feet at 1700 hours. Instead of being ridiculed the next morning for his mistake, the forecaster got a round of applause when he started with "put your money where your mouth is". That forecaster had to manually predict the future from experience and raw data off teleprinters. Now he would tell us what the more accurate computer models expected. Ask a computer about 25000 years ago and you have to give it human processed material as sensors only operate in the here and now. Computing power is a great tool for extending thought but no substitute for the same. Judgement (not AI) is a valuable quality that is not demonstrated by those who work backwards to justify their dreams instead of exploring the possiblities to discover the likely realities.
Real climate science is a great channel that goes into old news paper archives to show all the omitted data that was too inconvenient to include in the ever changing main stream graphs.
What I always love is how any time data is pulled and looking at pretty much anything. We always create a model where it essentially takes gathered data and then humans take anything they feel like to expand the data to make leaps. Then it turns out years later to be errored and not correct. How long before these new reports turn out to be off by some weird thing. Remember glaciers were supposed to completely gone 30 years ago and 50 years before then we were supposed to be going into another ice age.
"Then it turns out years later to be errored and not correct". Some past models got it right. Hausfather et al 2019, "Evaluating the Performance of Past Climate Model Projections".
Yes, scientists can be wrong, but does that mean we just give up trying to understand? Do we just throw caution to the wind and carry on with a course of action without even looking where that may lead us? The whole mechanism of science is that of actively looking for where we may be wrong and trying to correct it. Just because scientists _can_ be wrong doesn't mean that my pet theory is right. A scientist who has devoted a good deal of her life to the understanding of something is far more likely to be right than I am.
@@Aaron628318 I’d say you are on the right track, however it needs to be stated that far far too many scientists put out their theory as fact. The peddle it as if there is no doubt. And the politicization of scientific theory is where the real problem arises. We’ve seen it in climate and biological in the last 50 years. It is even worse now because people that question these theories are now being shut down by those in power when real science should always be questioned and tested.
Yeah how long before we find out if we look at spaghetti long enough it's not just fucking dense carbohydrate molecules!? It's like Science gets better at describing things that already exist. Like the poor and than good Climate change model.
@@Aaron628318 Yes they can be wrong, especially when their livelihood hinges on the correct answer to be produced. Note that not even one of the 102+ models have even gotten close to being accurate. Also note that virtually none of the retired scientists and some of the nonpublic funded ones agree with the Mann hypothesis. Not even the IPCC says it is man caused.....................lastly even if man stopped all CO2 emissions tomorrow, nothing would change, not for hundreds of years. Unlike the claim by Gore, CO2 follows temp, not the other way around. It is really simple to prove, right in your kitchen.
I like how you left out the weighted algorithm used to calculate the data, and that without it the hockey stick disappears. In fact, you can feed the program random data, and it will produce a hockey stick graph EVERY SINGLE TIME. That's impossible, unless the program is weighted to give a predetermined result.
Strange example... Mangoes ripen and they ALL fall to the ground whether eaten by monkeys or not. Moreover, if there were variations, that would be a better proxy for how many mangos are harvested by humans and taken home to be eaten or sold. (Monkeys seldom export mangoes outside their home range.)
@@mrs.w5145 Not really. I added a more serious, detailed comment right afterwards that expressed the hope that people would not just focus on inevitably misleading partial analyses that focus exclusively on particular examples of "positive" (GHG-increasing) feedback loops without also acknowledging the complex systems also feature sometimes active, sometimes latent "negative" feedback loops that simply can't be ignored but often are by the more catastrophically minded. (For example, a warmer climate is almost certainly going to be an increased-biomass world - albeit one with significant loss of genetic diversity. I appreciate that most people (myself included) would rather stick with what we've known during the entire history of our species since the end of the last glacial maximum, but a higher-biomass planet isn't exactly a catastrophic outcome...) Since I have limited hope that governments can/will get their acts together (I worked decades in the federal public service in my own country, 🇨🇦), I'm more likely to favour additional resources going to (politically easier) adaptationist policies that are more likely to be effective than preventative/mitigating ones that governments trot out to be SEEN to be doing something...
Yes we've all seen how well the models perform and how many of their predicted outcomes have come to fruition. I'm just giddy thinking about all the next predictions that will come true.
The only model you should follow is above the arctic circle. The melting of ice is the only parameter. What happens below the circle is just normal weather patterns.
You're being sarcastic but most of the models actually have been pretty accurate. People claiming otherwise are either cherry picking, lying about current trends, or both.
@@randyohm3445 he's being sarcastic over the stupid predictions of the coasts like NY being under water by now. Many scientific informed have made those predictions at least 10 years ago.
When I was a child I asked my father what we should do in preparation for the recent forecast of gloom and doom. His response was that the disaster never comes true and there is always a new threat imagined every 10 or 12 years because the old threat never happenes. My children can’t believe that politicians would be so corrupt and use fear to distract and to control people. In my 76 years I have observed the failure of every prediction of gloom and doom so proving my father’s observations to be correct. One day, my children will no doubt reach the same conclusion and warn their children to fear the only politicians wanting to create nuclear war.
Well Said, In the last 40 years we have had Acid Rain, Comming Ice Age, Ozone Hole, Global Warming and now Climate change + Rising sea Levels. Yet politicians buy houses next to the sea, and the worlds militaries use billions of gallons of fuel, and we are told we are causing these issues. Well if we get to a tipping point maybe we should stop wasting so much energy on the war machines. Never hear any politician saying that.
Care to be a bit more specific and state what a couple of those predictions were and when they were made? Sometimes we actually acted on dire predictions, such as pollution in the early '70s, and things got better (or were otherwise averted).
The hole in the ozone layer? Serious issue, took a lot of work to fix it. Will be repaired in 2 centuries if nothing goes wrong. Year 2000 issue? Yeah, I was there to fix it. It took us two years to prevent the biggest issues and like in many companies, we were forbidden to talk about the remaining issues and just ascribe them to generic software issues. I think it's going to be hard to name a single scientifically verified issue that went away just by itself.
Oh... It always bothered me that the called it "hockey stick" when they aren't that shape; they make a U at the end. They meant ice hockey stick... That penny took a long time to drop.
"Going through recent papers in atmospheric science and translating them for a popular audience" = science communication!! I love it, as I encounter more and more climate journalists and science communicators, I want to know more about how I can potentially be one-- so please DO keep making these videos, I love them!
Yes please keep pushing lies that reinforce the mainstream fraud about unscientific man made climate change when the Earth is not even getting warmer pretending to analyze the data but having just the father of the fraud Mann himself as your source. Just like using a convicted serial killer's opinion as ultimate evidence about his innocence. Summarizing: "I was wrong and altered the data, manipulated the equations but in the end I was right by magic, let's save the Earth, folks." You clearly know science as well as the guy in the video.
I hate RUclips hard youtube's anti spam to makes it for me to tell people about other websites. edX has free self-paced classes (MOOCs) on things, including on MOOCs on climate. edX also has a class titled "Science Communication". One class they've I've watched a lot of (Making Sense of Climate Science Denial) is geared specifically to debunking climate myths.
@@HiddenHandMedia I can. It pays well. You get loads of travel curtesy of the tax payers. It makes it easier to get stuff published. You can make up any rubbish and still sell it. You can just explain everything by blaming emissions, like some 15th century charlatan blaming it all on witches. You can commit crime in plain view yet claim you are some kind of hero acting in the public good. Plenty of reasons why the lazy, weak and corrupt join the climate franchise.
Got a problem with the tree ring core: depending on where you get the core you could get different ring thickness and spacing, just by looking at that one photo. Trees aren’t perfectly circular and some rings on the photo are right against each other on one side of the tree but on the other side those same rings are farther apart.
You need a lot of trees and sections from different directions and you need to establish how stable the water supply was. Worries about tree data is one reason there have been so many other proxies studied such as trapped gasses in ice and pollen distributions. The trapped gasses data is good because it samples the atmosphere itself which averages over the globe. On shorter scales
In addition to what you said about tree ring widths, there are other factors that affect the width of a tree ring than just temperature. A wet year gives wider rings. If the weather was unusually cloudy in a year, you will get narrower rings. Neither of these are accounted for in their proxy series.
@@e-curb with a large enough sample and careful selection they can be, for example tree rings at higher elevation respond to temperature more than rainfall
@@Benthorpy "careful selection", meaning they leave out the data that doesn't support their pre-determined conclusions. This was documented in the Yamal series. Data from trees that lived 1000 years ago that didn't show the warming they were looking for, was simply left out.
I am not qualified to answer this but if another proxy shows high temperatures and trees grew fast than it must have been a favorable temperature condition with enough moisture too. Suddenly with Covid, nobody trusts science anymore but medicine was always a bit a art and a science together. For many diseases we don't know exactly the cause. Some medicines work but we don't know why exactly. Etc. In climatology, there are many questions where the answer is not yet fully clear. But at the same time, this field seems to have the most humble and honest people. Not a single climatologist is a "star". Most people will not be able to give a name. They show the error bars. They show their evidence. They are often a bit shy and nerdy and find it hard "to sell" their knowledge. (ex.: Jennifer Francis )In an interview with a skeptic however, they give very eloquently their "arguments" but rarely some evidence which can be checked. They rarely have done good discoveries themselves, they just criticize. So what they say seems not so different from their opinion, their gut feeling to me. " it will all be fine" OK, do they have a crystal ball? No, so we better be careful. If the skeptics are so sure of themselves they can promise to pay if something happens. We don't hear such promises however.@@SickPrid3
Warm temps may actually stunt some plant growth, if the temps get too high. Also c02 levels also would make plants grow much faster. Didn't they also add in some data at the end to inflate the modern temp delta. Not sure, but think it was sea surface temps they added. All in all the old chart was almost worthless, I don't think humans can out perform an ice age so id be willing to take a chance on a bit of extra heating if it got us a few more years out of an ice age.
@@jean-pierredevent970 These days the public is more awake of who funds "the science" and that includes covid, paid in large by big pharma and philanthrocapitals like Bill Gates. "Who pays the piper calls the tune", in their research is tainted by having a predetermined result or they lose their grant funding. Even the most humble of climate scientist has to put food on the table, put a roof over their heads and put their children through college and university, has aspirations to climb the greasy pole. Going against the narrative paid for funding from UN Agenda 2030 sustainable development goals, Federal government and Climateworks Foundation etc etc can be detrimental to the wellbeing of their careers.
Apologies if you have a video on this: Since most of the modern temp data is coming from cities, and cities are warmer then the countryside and they get warmer as they grow and industrialize, why should the tip of the stick be considered accurate when most of the data is very inaccurate, especially when you consider the US built around 1500 temp stations in the countryside about 17 years ago, and over the 17 years they have observed no warming, while the IPCC says the US has warmed significantly?
The only charts that show no warming are the ones that don't adjust for methodology. The NOAA publishes adjusted data with transparent reasoning that shows very similar temperature changes. And it is worth noting that a single region not experiencing significant warmth over a 20 year period wouldn't be out of the ordinary, it would be contrary to expectations if it was global or if it lasted much longer which it doesn't. Even the raw data shows significant warmth on a trend line over the past century if you zoom out on those 17-year charts.
@@waynepatterson5843 Wayne Patterson is an imaginary person and as such all arguments made by them can be discounted as not real. Wow it's very easy to win arguments this way, thanks for the demonstration :)
A single paper, especially one using very sophisticated modeling, should always be taken with a grain of salt. There's a large potential for error of all sorts creeping in. The overall conclusion is supported by a very robust body of research, but I wouldn't be that confident about the specific details, especially regarding the deep past.
Totally correct. Reinforced by this paper showing the error propagation over time is so enormous as to make these projections meaningless. Reliability of general circulation climate model (GCM) global air temperature projections is evaluated for the first time, by way of propagation of model calibration error. An extensive series of demonstrations show that GCM air temperature projections are just linear extrapolations of fractional greenhouse gas (GHG) forcing. Linear projections are subject to linear propagation of error. A directly relevant GCM calibration metric is the annual average ±12.1% error in global annual average cloud fraction produced within CMIP5 climate models. This error is strongly pair-wise correlated across models, implying a source in deficient theory. The resulting long-wave cloud forcing (LWCF) error introduces an annual average ±4 Wm-2 uncertainty into the“The simulated tropospheric thermal energy flux. This annual ±4 Wm-2 simulation uncertainty is ±114 × larger than the annual average ∼0.035 Wm-2 change in tropospheric thermal energy flux produced by increasing GHG forcing since 1979. Tropospheric thermal energy flux is the determinant of global air temperature. Uncertainty in simulated tropospheric thermal energy flux imposes uncertainty on projected air temperature. Propagation of LWCF thermal energy flux error through the historically relevant 1988 projections of GISS Model II scenarios A, B, and C, the IPCC SRES scenarios CCC, B1, A1B, and A2, and the RCP scenarios of the 2013 IPCC Fifth Assessment Report, uncovers a ±15 C uncertainty in air temperature at the end of a centennial-scale projection. Analogously large but previously unrecognized uncertainties must therefore exist in all the past and present air temperature projections and hindcasts of even advanced climate models. The unavoidable conclusion is that an anthropogenic air temperature signal cannot have been, nor presently can be, evidenced in climate observables.” www.frontiersin.org/articles/10.3389/feart.2019.00223/full#B97
And I don’t hear any factors for volcanic activity and cloud cover (since CO2 is a minuscule component compared to atmospheric water vapour) entered here. Which means the assumption that anthropomorphic climate change is the sole driving force for temperature change is probably Hawthorne Effect.
@@cestmoi7368 The water vapor component is a big deal. The problem with higher temperatures is that that will increase the vapor levels too, then clouds go up and don't come down. Obviously this isn't an overnight event but it would turn earth into a planet much like Venus over time.
My concern is that (western) governments have chosen the alarmist view of an extremely complicated and inconclusive body of work, then say "the science is settled" and go about scaring school kids and gullible adult voters. The only thing that's settled, now that we've swallowed the big green deal, is a lot of people are going to get very cold and hungry in coming years.
@@paulwooton4390 So much money. So little results. The science used to be settled that the earth was flat. The science used to be settled that scurvy was could not be helped by citrus fruit, but exercise and laxitives. Alarmist scam.
Exactly, it is laughably arrogant when people claim to that humanity could possibly destroy the planet over the course of a few centuries, the same planet that has existed for untold millenia. Or that the Earth needs people to "save" it. For the entire history of humanity up till now, humans have been living at the mercy of the whims of nature, the sun and stars, and I don't expect it to be different for the foreseeable future.
The truth is that if we are to take climate change seriously and truly want to not make harm (as some may claim the Industrial Age has caused) we must recognize the alarming similarities to said human damage that all ready happened, we all need to encourage different opinions even those who we vehemently disagree with and a free respecting debate, we need to put emphasis on not turning this into a political show and most certainly eliminate any possibility that greed might somehow destroy different or efficient ways to produce clean energy, we need to empower normal people to make good decisions for the environment not demand they do or lecture them to do so, we also need to stop fear and hatred revolving this issue no good will come from young man and woman deciding to not procreate based in part large or small of climate change, the list goes so far climate change is proving to be a business before anything wether it is fueled by opportunism or power, guilt or fear it matters not, my ancestors have been planting trees way before science deemed it necessary or beneficial.
@@superbarnie I see, it seems I went overboard, for that I ask forgiveness if I made you uncomfortable. I also need to confess to that I used to be a person that believe in all that you have said in your comment, I still do believe in recycling but it has changed drastically as today I recognize a lot of the flaws humans bring to the table when it comes to this discussion, so I just want you to know that my oversized comment came from a place of respect and wanting to discuss with people who still blindly follow the craze climate change has become.
@@superbarnie the people who claim that climate change will destroy the world are not helpful at all. the biggest victim of climate change will be ourselves, and our civilisation. we can't shift the entire earth from it's orbit by an inch, but we don't need to that in order to melt the poles and flood our cities. even in the worst case scenario, "life finds a way". but we can destroy most of the life we have today, and we won't live long enough to see what happens afterwards. and we are not 'at the mercy of the whims of nature'. If you are cold, you turn up the heater, if you are hungry you go buy food. we have split atoms and communicate at the speed of light. pretending we're just sitting here waiting to see the cards nature has dealt us is just ridiculous.
I am always interested in the crazy amount of ice that covered the northern hemisphere just 10 thousand years ago. When they say that New York was covered with 500 feet of ice, I see the amount of global cooling that got the planet in that position and the amount of warming that got it out had to be considerably more than we talk about with the hockey stick climate change.
You should check out what happened during The Great Oxidation Event, which is probably the greatest mass extinction event the Earth has ever seen - almost spelled the end of life actually. It shows what happens when the correct amount of greenhouse gases do not exist. i.e. too much or too little has a detrimental effect on the Earth's environment.
@@tomgreene1843 I don't remember anyone saying that CO2 is the ONLY cause of warming. There is a natural 100K year cycle, of cold and warm, the last one peaked about 20K years ago, and was 4C below today's temperature. The scary part is we're well ahead of the expected warming curve. So on the bright side, we won't have to worry about another ice age in 80K years, which is a good silver lining. But at this rate we'll be too worried about food, and starving in 25-50 years.
I wish this graph and paper didn't get so much attention when someone like Charles David Keeling's research at Mauna Loa was arguably the most important for our understanding of climate change, yet it gets very little recognition in the public eye.
Ofcourse there are many better contributers, but you can see from this how climate deniers drive the public debate wheter or not they have science behind them
@@MrAntice I don't see any either, it likely gets slapped onto videos by some algorithm that can pick up climate things are being discussed but is probably not reliably capable of determining if it's a video with accurate information or just plain misleading. So maybe it was reviewed manually by a human later and the warning label removed? Or maybe youtube/google by now have some kind of more processing power intensive second system that reviews videos if requested before it gets seen by a human, honestly don't know how their vague systems work. But I have noticed that some videos will typically get warning things slapped on it early on and they disappear over time when they probably shouldn't be there.
@@extrastuff9463 Analysis software is computationally expensive, and AI's that use trained detectors are even more so, So maybe it's a case of them only using their AI on videos reported as controversal/has certain keywords in their title/descriptions. I looked into the price for an image processing AI that uses trained detectors for analysing orthophotographic images. (used for counting trees, animals, detecting cracks in pavement over large areas etc). The prices are pretty darn stiff to say the least, and I cant imagine video with sound being any cheaper computationally than 8 bit orthophotos even if the photos are in the GB range size wise. (orthophotos do not contain compression btw. since that would cause a loss of critical data for the detector algorithms to work with).
I have lived 100 yards from the quay of a small coastal town for 35 years. During this time, apart from minor flooding at high tide on spring tides when there is a storm or strong onshore wind and which goes down when the tide goes out, I have noticed no rising sea levels.
Cool, I'm sure everyone here is genuinely pleased for you. Now would you please tour the Pacific islands & tell them their graveyards aren't under water? Explain to the people of Wales why coastal villages have been abandoned & the villagers moved inland? Explain to the taxpayers of London why the Thames Barrier was built & why it has been used? Explain to the people of Bangladesh what's happening to their country?
I too live on a geologically static tectonic plate and have noticed from photographs more than 130 years old, that indeed, there is no appreciable difference in the level of the Pacific Ocean. However I’m sure the other commenter to you has accounted for tectonics because of course we know the oceans aren’t continuous.
I lived in Honolulu for 20 years and the sea level has risen enough to make Kaka'ako inundation a regular event, when it used to be just during spring tides. The average rate is only 1.4 mm/ year over the past 100 years, but when you live on the edge a small change is a big change.
It seems to me a waste of time if it 7 years to make some estimates? They could have asked University of Copenhagen: ruclips.net/video/WE0zHZPQJzA/видео.html
So, the guy who created the hockey stick was asked to supply the data for his study, he said it wasn’t finished. Asked again later the data was vanished. So basically the hockey stick can’t be verified.
The original "hockey stick" is irrelevant now, as it has been independently corroborated so many times by other teams using better statistical methods, more evidence, and higher resolution. They did it better than Bradley, Mann, and Hughes, in an attempt to bust them, and corroborated the findings instead over and over between 1998 and today. That's why MBH1998 is superseded. It wouldn't even matter if Mann done the things the oil industry shills accuse him of, since the corroborators don't rely on his work. The hockey stick shape of the Holocene temperature record is one of the most thoroughly corroborated findings in science.
@@LSuschena They are being removed so if you are still interested, I can put them on another youtube video called Measuring the Human Impact on Climate Change The Hockey Stick Graph.
That is why I beg people to read "An Inconvenient Truth". Notice the publish date before. Notice all those "in 10 years this" or "in 20 years that" have come on gone. Nothing has come true...
I would like to request clarification on one point in this climate change discussion. I have heard (please correct me if I am wrong) that of all CO2 emitted into the atmosphere each year, 95% of it is from natural causes. If that is so, and only 5% of CO2 emissions is from ALL human activity, and America's contribution is only a piece of that, how is forcing everyone to drive electric cars going to change these numbers, especially in view of the facts that China is frantically building more coal-powered electrical generation and all electric vehicles are, essentially, coal powered anyway?
Simple clarification: nature not only emits CO2, it also takes up CO2. Right now, nature is taking up more CO2 than it emits. So, while our human emissions may be 'only' 5% of what nature emits, nature takes up more than it emits, meaning that our emissions are 100% responsible for the increase.
That is a good question. Here's another one. Somewhere in these videos is a clarification of ice cores showing an increase in CO2, but it takes place after the warming. I wish I could find that video. It makes sense if you think about it. Warming would cause the growing season to last longer so plants would be converting CO2 to O2. Drop in CO2. Then planets die as temperatures drop and CO2 goes up. Don't take this as any type of proof, at most it's junk science because climate isn't my area of study.
@@francisdhomer5910 You're actually not that far off - in the past warming *in some parts of the world* started before CO2 increases. This is related to the so-called Milankovitch cycles, where solar energy is distributed differently over the earth depending on a set of orbital parameters (the earth itself wobbles, and so does the sun-earth distance). Here's a pretty good video that explains this (there are many more, some with more details) ruclips.net/video/iA788usYNWA/видео.html&ab_channel=It%27sJustAstronomical%21 The CO2 is mostly a feedback to the warming, thereby further enhancing the warming. Note that in the Northern Hemisphere the warming may *follow* the CO2 increase, whereas in the Southern Hemisphere it is the opposite, and that there are parts of the earth's history where greenhouse gas increases (not just CO2) likely triggered the warming (e.g., the so-called PETM).
Humans contribute 3.8% CO2 not 5%. Notice that in the 2 years after the start of COVID19, there was no noticeable dip in CO2. Cars only contribute 1% of CO2 on earth. Therefore, the political class is hoaxing us.
@@Marco-it2mr Wrong. CO2 follows ocean warming in BOTH HEMISPHERES. However, they simply alternate according to the available season. (Subsequently, Marco proved this wrong)
Think you could have mentioned professor Keith Briffa's treering temperature reconstruction which didn't switch data sets, to weather station temperature records (Orchard fields airport/O'hare) Mann's "data" didn't do to will in the 2019 US supreme court case's 18-1451 & 18-1477 either.
When the raw data Briffa used was found and analyzed independently, some trees showed the temperature trend they were looking for, while other didn't. Instead of trying to figure out why, he just ignored the data that didn't support his predetermined conclusion.
Few question to consider: 1) Why proxy data is used only for the past, but not for the present? Why can't we use the same methods to "measure" the current global temperature? 2) Why is data of present global temperature is gathered from cities and airports? These places are typically way warmer than their surroundings? 3) Life was thriving under warm temperatures. Most of global extinctions happened during ice ages. Why should we be worried about climate becoming better?
@@FergusScotchman You like questioning stuff? That means you are scientist denier. People of science never question anything - they believe the dogma and follow what politicians and journalists tell them to follow. Stop questioning stuff, of else you will become climate denying MAGA conspiracy antivaxxer of putin's troll farm.
You have to wait 30 to 50 years for ice cores so that the ice forms and stabilizes. CO2 increase modifiés the growth of trees. Extinction during ice ages ? Check again.
@@philippesarrazin2752 Tree rings can be checked within 2-3 years. Yes, CO2 is the most important natural gas on this planet. Yes, every ice age caused at least some species to go extinct, while over half of great extinctions were caused by ice ages.
@@Mesjach Science is about trying to disprove your models, so i guess the /whoosh can be attributed to you as well? There's a large number of inconsistances with almost every single climate model presented, and that is most likely because refusal to implement data that may be conflicting your model. Imagine that? Some scientists have to big of an ego to let go of their pre-concieved ideas? Almost like they're also human. There's a whole slew of questions i've had for scientists within the field, which they've never been able to answer. They seem to ignore these in their models. If it is intentional, or just that they don't think it can be of any significance, that's something only they can answer. However, if it's that it's not significant enough to use in a model, then it would be a simple answer. Would it not? These questions range from things like oceanic water pushing into the mantle, to quesioning how climate friendly solar/wind really is considering the need to mine the components (with increased energy demands globally). I'm not questioning climate, i'm questioning the models, and missing data.
Stop repeating bollox, care to substantiate that ridiculous statement you obviously copied from lies spread over the internet. Are you capable of free thinking?
@@SoloRenegade : How is it that deniers who pretend to care never pay attention to the facts? Or do you know it's false and don't care? Hiding data didn't happen. It was a baseless accusation that was thoroughly investigated by a dozen official and media entities and found to be false. It was a slander by fossil fuel shills based on taking a few phrases completely out of context and misrepresenting them. There is nothing simple about climate science except the primary factor that more CO2 traps more heat. If you know how much CO2 were adding you can predict ow much warmer it will be. Today's temperature was accurately predicted in the 1970s. There is a record of global temperatures that show a very steady trend. Industry is changing the climate but not in a controlled way. We can only hope to mitigate the damage by reducing industrial emissions rapidly.
@@lrvogt1257 CO2 has a logarithmic affect on temp, even the climate crazies don't deny that because it's scientific fact and has been proven countless times throughout history. That means to get to even 3C of global warming we'd have to get to 1600ppm of CO2, and 3C global rise is nothing. NASA/NOAA alter the temp record and refuse to share how and why they are altering the record so that others can try to replicate it (peer review). It was factually warmer in WW2 than it is today. and even as CO2 rose massively after WW2, temps plummeted for decades. And during the roman era it was up to 10C warmer than it is now. Mann factually lost the court case in Canada for refusing to subject his work to peer review. Therefore he was ruled a fraud in court when all he had to do was open his research to the world (if it's not available for peer review, it's not science).
Question: I might have missed it in Clark’s video, but since the proxy data seems to be of prime importance, to what extent in time does this data exist? Is every set of proxy data valid over the same time period? If not, then what happened is that the hockey stick was assembled by merely stitching smaller data sets together to create data over a longer time extent. I suspect that is not a valid way of creating anything meaningful. Now, if each proxy dataset extended over the same time period, and they all had the same character (peaks and valleys in the same locations), I could see that this might be meaningful. Otherwise, stitching together proxies is invalid, IMHO.
But what Mann did was switch to a modern technology for the last 2 decades because the tree rings were not showing the warming he NEEDED to show. That is what started the big IPCC hockey stick scandal & the walk out of lead IPCC scientists. The creation of pseudoscience was born.
AFAIK that's how proxy data sets are generally callibrated. E.g. start out with thermometer measurements and compare them to tree rings and lake varves, then compare those to chemical markers in ice, and so on. That's the major reason you get less precision the further back you go. IIRC the "trick" that got denialists so exited during "climategate" was a mathematical equation that lined up a set of tree ring data with other known proxies (there were other, known, factors that influenced the tree ring data, but figuring out the relationship was difficult).
@@henrikgiese6316 Hi Henrik. That is precisely my point. Not knowing all the different factors that affect tree ring data, the ability to accurately “stitch” them together relies on your confidence that you have completely eliminated all other factors except CO2. By not making public his method for doing so speaks volumes about his credibility as a scientist. IMHO his hockey stick graph should be regarded as invalid, and all future pronouncements by him should be discounted by the fact that he does not the follow scientific method.
Now do one where you go back millions of years to the Jurassic and other periods when CO2 levels where 4-8x today’s levels and the Earth was a biological paradise.
Grow up. At those times there were no humans. No mammalls, and none of the species we depend upon. There *were* carnivorous insects a foot long. The relevant period for *us* is the period over which we and the species we depend upon evolved. CO2 has not exceeded 300ppm in over three million years. *that* is the scale to consider.
I've grown weary of wealthy policymakers telling me how I should live while they'll likely continue enjoying steaks, air conditioning, and all of the other amenities I of modern society. I have no problem with using a combination of renewables and nuclear. I certainly don't think that renewables alone are ready to be our only source unless make a real effort to decentralize how we generate our energy. I just refuse to go along with any scheme that doesn't involve an effective solution to the energy-production end of the equation. Then there are many who carry the misunderstanding that having an EV will automatically result in fewer greenhouse emissions. Maybe if you are using the most efficient power transmission lines and the fewest amount transformers and substations to the tap, then yeah.. it might be more efficient even if that energy is generated by natural gas. At least that what I've been told. Seen one meta study which tried to make this point but it got lost in the noise. Is it really more efficient to generate electricity with natural gas and send it to an EV or is it more efficient to just burn the fuel in the ICE to make immediate use of it for locomotion? One argument I've heard is that the fossil fuel industry receives tons of subsidies. Well, if that is the case.. which ones? I'm all for nixing those subsidies as a step towards leveling the playing field.
Very good points! It seems unlikely we can generate enough electricity from wind and sun, and hydroelectricity is very limited unless you live in a really mountainous country. Nuclear, aside from being historically much safer than it is given credit for, can generate a lot of power. In terms of EVs, the overall efficiency of generation and distribution cannot be made much better than the efficiency of ICEs though petrol and diesel contain a higher proportion of carbon than natural gas. One thing that concerns me is reliability of supply. At present if there is a power cut for a few days, we can use gas fires and the like. If we only have electricity we will be d****d cold!
They should remove all subsidies from power generation companies including the so called green ones. See who comes out more cost effective then! Survival of the fittest
I don't get your point. Your final] graph shows warming of about 1.2°C over the last 150 years, which is not in dispute. However your claim about the Medieval Warm Period is very much in dispute. Signs of it have been found in the southern hemisphere even Antarctica, where it appears to have been less marked than in the northern hemisphere but still present. There are also many other studies which have found good reason to question how much greenhouse gases have contributed to temperature rise. The GMT during the Holocene optimum is also in question and may have been between 2 and 3°C warmer than today, which if true means today's GMT is not unprecedented. It all amounts to which proxies you want to trust and which to discard. Remember, science is never settled, and if you claim it is, that is not science.
"However your claim about the Medieval Warm Period is very much in dispute. Signs of it have been found in the southern hemisphere even Antarctica, where it appears to have been less marked than in the northern hemisphere but still present. " But it's not synchronous the warming happens at different times at different spots on the earth--there is no other globally synchronous warming like what we have created.
Hi Simon, this new paper mentioned the tilt of the earth. I've watched loads of videos about the milankovich cycles, so, while i understand in general how it works, I've seen nothing tying any of them to a time period. So, i can't figure out where we are right now. Could you take this as a request for a video topic?
The last four glacial periods were 105 thousand years apart; synchronized to the Milankovitch cycles all.triggered by slowly changing greenhouse gas concentrations. The Milankovitch cycles are in a cooling phase now, as they have been for hundreds of years and will be for hundreds of years to come; those orbital eccentricities apply a cooling force yet are not driving the warming.
This channel has another video explaining how solar warming gives a different result. The stratospheric temperature changes differently if solar radiation is the cause. It clearly demonstrates that what we see now is caused by the increasing greenhouse gas4
@@DazzaOnGoogle I believe that climate change is real, anthropogenic, and a threat to humans. I want to see dates, numbers, measurements, and projections because i'm curious, but also to win arguments :p
@@manjuh4236 Win arguments? You might win them but they won't be recognized by the majority of the deniers out there. You'll write a paragraph or two with whatever dates and measurements you want but they'll just respond with "LOL nice try SHILL. Just shows how indoctrinated the libTARDS r". But someone's gotta speak the truth I guess, so I admire your compassion to seek and spread the truth.
@@DazzaOnGoogle Keep in mind nobody has successfully described a mechanism for variations in the solar wind to significantly influence climate especially during industrial times. Look up “Solar Cycle: and “Introduction to Solar Radiation”. Also look up “Ask NASA Climate - Flip Flop: Why Variations in Earth's Magnetic Field Aren't Causing Today's Climate Change”. Good source for laymen, but other sources are available. As for papers, there isn’t much out there about the lack of correlation between completely unrelated things like solar flares and climate change, as the effects from solar flares last for less than a day and are one time events. Climate change requires a forcing, and for an event that lasts less than a day to cause climate change, one humungous forcing like a giant meteor strike or a volcanic eruption bigger than any in human history would be required. Note that on scales from minutes to hundreds of thousands of years, total solar irradiance is practically constant; that its tiny variation on an eleven year period (one part in a thousand from the mean) correlates with no climate or weather trend; only short term changes in the atmosphere. "The value of the constant is approximately 1.366 kilowatts per square metre. The “constant” is fairly constant, increasing by only 0.2 percent at the peak of each 11-year solar cycle. Sunspots block out the light and reduce the emission by a few tenths of a percent, but bright spots, called plages, that are associated with solar activity are more extensive and longer lived, so their brightness compensates for the darkness of the sunspots".
The most accurate statement in this video is the fact that our scientific knowledge is always expanding. Unfortunately, many people, including scientists, are very resistant to new ideas that challenge widely accepted views. Just as the hockey stick graph has adjusted and fine tuned, other discoveries have been made. We have learned that climate is a very complex subject. We constantly discover new variables that have an effect on climate. You can never say that any theory is carved in stone. A true scientists knows that the more we learn about something, the more we realize what we don’t know, which is usually far more than we do know. Question everything!
Valentina zarkhovas work is quite compelling and it pretty much states in a nutshell that climate is mainly effected by the sun! Not us. Science tells us most of the time what is not, not what is.
We've known that carbon dioxide was a greenhouse gas and that increasing amounts are warming the planet since the 1950s. That is data not theory. All subsequent data has confirmed over and over. Saying scientists aren't interested in new information is completely ridiculous
Actually, the down slope of the original hockey stick may still be valid for the northern hemisphere ? The 2 hemispheres do not have the same temperature evolution profile, do they ?
NO, the downslope of the hockey stick was within the time period where we have THERMOMETER records and these showed an INCREASE in temperature, thats why they HID the downslope.
@@peterjones4180 Come on ! 2000 years of downslope ! Actually even Andy May, a guy who publises regularly in WUWT posts regional reconstructions and if you do some research you will that the NH temperature furiously looks like a hockey stick.
@@philippesarrazin2752 You may be referring to a DIFFERENT downslope, I was referring to the temperature downslope that Mann deliberately hid behind another graph line so that others would not realize his data was NOT fit for purpose.
The graph at 7:10 implies +/-0.5 degrees error in the proxy calculations by its width. However proxies are calibrated against each other by their originating researchers, coral to pollen to tree rings, and the ones that don’t match are thrown out as invalid. So the shaded red zone could easily be twice as wide and include significant up and down swings. As far as the last 100 years nobody is arguing that temperatures haven’t gone up about a degree. Instead of panicking about this one degree, maybe a more valid point is that the preceeding 7 degree rise seems to have been beneficial to mankind, and detrimental to wooly mammoths.
That's an argument that is never made. I'll point out one more thing that everybody overlooks. There was more warming in the first third of the 20th century when man made co2 was much lower than there was in the last third when mm co2 was multiples of the earlier period. ( it didn't warm at all between 1944 and 1980 . whoops)
@@notacommie7154 kinda like all that CO2 we've made in the last 20 years and all that warming that didn't happen. (Well, unless you listen to those studies that magically found after the fact that the "pause" never happened.)
@@beetle3088 that's because there is zero correlation between co2 and planetary temps. An example of telling a huge lie, repeating it and relying on the scientific illiteracy of the public to create the consensus. Disgusting.
medieval warm period, a 'regional' event recorded in tree rings across the planet. 300 years of excessive warming is just dismissed as 'regional' we have 3 weeks of days in the winter of 30 degrees below normal. that is 'weather' we have one day of 105 degrees and that means it is man caused global warming.
Tree ring width is more related to moisture than temperature. So wider rings may mean more rain not higher temps. In fact higher temps could result in thinner rings.
Not exactly. There are several causes for tree rings to widen; moisture and temperature. In dry climates the rings are mostly affected by moisture but in temperate climates (most of the north and southern hemispheres) they are affected by temperature mostly.
As you said Mann relied quite a bit on tree rings to determine temperature...In today's world, where we can measure temperature to a tenth of one degree how accurate are tree rings?
Questionably accurate, at best. The problem is that whilst it is not unreasonable to treat tree growth as a proxy for warmth, tree growth is also affected by many, many other factors, none of which can be separated out. Really, all proxy data for warmth have some deficiencies (or else we'd be able to get accurate, uncontroversial estimates of global temperature for as far back as we'd like), and climate "scientists" have done a great deal of damage to the credibility of their claims by indulging in some pretty shady practices in how they manipulate their data, and more so by how they present their findings. Now, that said, I also find it inconceivable that human activity has had NO impact on the global climate. Is it to the degree that some claims have stated? Probably not, it turns out. Is it far more than is good for us? Probably yes, and this new (and apparently much more rigorous and credible) paper may well be a good place for climate scientists to start making that case properly. I would also add that regardless of all of climate science, it is an absolute fact that the world needs to stop using fossil fuels (or at least greatly decrease their usage, and limit them to those things where we kinda need them for the moment, and work on finding alternatives so we can completely eliminate them). They are a finite resource that have fairly unpleasant environmental effects even if you totally ignore their potential for causing warming, and getting away from their use would be a really, really excellent idea. Just, let's have that debate on its' actual merits, backed by actual science, and not the bullcrap that the climate science industry has been peddling for far too long
@@talltroll7092 Ok, you sound reasonable to a point...Until you come to what can only be described as the absolutist point of view " it is an absolute fact that the world needs to stop using fossil fuels " even your bowing to reality with your caveat that followed shows your Myoptic vision that only sees oil and coal...and your willingness to throw the baby out with the bathwater....You have no appreciation for how pervasive Oil and Gas are responsible for the quality of life you enjoy...Your health, your wealth, your freedom from drudgery is all made a reality provided by Energy from Gas and Oil...The Concrete that builds our cities, the Fertilizers that are needed to grow the food on your table the, plastics that replace wood and so much you use comes from Natural Gas...All I ask is that you look before you force us all to jump this green shark
@@talltroll7092 That's a pretty well rounded, and reasonable view on the subject. It falls somewhere between complacency and hysteria which is exactly how we should be approaching this.The only thing I ever see in science and academia is "could", "might", "maybe", etc. They honestly don't know. All I see in politics is "definitely", "will", "inevitable", etc. The experts. The bottom line is that if you follow the science far enough, you'll find the money behind it.
First step would be to convince China to reduce their pollution... instead the west is spending massive amounts of taxpayer money to reduce pollution (while increasing the cost of living for those taxpayers), while China says the will continue to increase the amount they pollute and western governments say "Sure go ahead!".
@@lrvogt1257 Most people don't have the luxury of aircon. There are regions of the planet that are very warm year-round, and animals seem to thrive in all but the most volatile places, unsurprisingly. Indeed they are remarkably similar to humans in that regard.
@@Generative_Midi_ Indeed. those individuals and species who don’t have the ability to adapt quickly enough will have a difficult time as the tropics become hotter with an increasing number of extreme heat events.
There still seem to be some issues with forecasting. Meaning that the further into the future you predict a model, the less accurate it will be. There are several reasons this is the case, for example we can't predict volcanism or in which direction solar events will propagate from or whether we would intersect with them. Politically this is a problem because people on the alarmist side will take the track of the worst possible projections and present them as the most probable. This in turn creates a backlash because the only options on the table are the most disruptive, costly, and radical. This results in deadlock where more modest modifications which could still make a positive impact are not implemented. Next considering how dense our current data collection methods are, we have yet to establish that the implementation of various "renewables" has made any positive or negative impact at all as positive results fall within the margin of error in the predictive models, and the cultish fervor around discussing the topic prevents consideration of whether one or more may have a net negative impact. This is foolish because if we are wasting resources and time that could be shifted to better solutions, we shoot ourselves in the collective foot. In regard to the reanalysis, we are looking at a dataset that is very indirect in it's predictive capacity of permanence or runaway. Meaning, while the study uses a multidisciplinary approach, it is still focused on air temperatures, which are easier to gather large sets of data about, but are otherwise a result of changing climate, not a cause. Oceanic conditions are the ultimate arbiter of air temperature, but our knowledge of them is vastly less than of air conditions. We have detailed knowledge of some areas, but we have no idea what contributions to understanding what is actually happening are to be found in unexplored areas. We do know ocean conditions plays orders of magnitude greater of a role in determining terrestrial climate than terrestrial climate plays on oceanic climate. What does that suggest? Well, terrestrial climate can fluctuate wildly in a short period with minimal impact on the oceans, however, a change originating from the oceans can cause much longer term sustained alteration of terrestrial climates. we don't actually know how quickly greenhouse gases can be removed from the air, or if warming to a threshold could trigger an equally short cooling backlash as CO2 is pulled into the ocean as carbonic acid and polar regions re-glaciate. Again this is because the models don't project well into the future. the "we keep warming till we all die" scenario seems to be as probable as the opposite "we keep warming till the saline ocean currents shift and plunge us into an ice age. There is still a lot of room in the middle of those two scenarios where we could spend more time gathering oceanic climate data and making better predictive models.
The most sensical approach to the data that I've heard. I too am suspicious of volcanism, solar events, and the oceans ability to process CO2. The amount of CO2 in the atmosphere is .04%. How much of an effect does it really have at .04%? Trees and plants grow faster (what we need for food BTW) or do we burn to a crisp at .05%??? I'm not on any bandwagon simply because I don't see one that I can jump on.
@@lrvogt1257 That's a correlation, which means those things *can* be linked. Correlation is not the same thing as Causation and that's where the rub is for half the population. 1909 being a record cold year does not establish any firm connection to warming as 1902-1908 saw multiple volcanic events with large cumulative ash releases. The impacts of which can vary greatly depending upon where the eruptions occur, the size of particulates, how high they are delivered, the wind currents, seasonal changes at that time and the strength or lack thereof of systems like El nino. The absence of that volcanism or a different geographical layout of eruptions could have otherwise saw 1909 as a normal or mildly cold year. As a result the baseline for the start of warming could be further back. we don't actually know that much about how volcanic activity alters climate and on what timescale. Even today we are surprised by the results of the last major eruption in Iceland. So here is the common low resolution theory based on correlation: Humans release CO2, CO2 increases in the atmosphere, it retains more heat than is radiated into space, then temperatures rise, will never stop and we all die. That is neatly wrapped up and seems rock solid, so that's where we've stopped. The reason why you have such a large amount of people who are either opposed or just apathetic is because when something in science is so neatly wrapped up and straightforward, it's usually wrong. Previous recent catastrophic models claimed we've already passed a (few) no return point(s) and seal levels would have risen 6-8 feet globally, which didn't happen. The frequency of apocalyptic climate predictions is getting close to the frequency of "the re-re-re-re-revised date of the apocalypse decoded from the bible." It doesn't help that advocacy of climate science has become dogmatic. Opposition gets criticized for poking holes in the models and theories, but no one stops to ask why there are holes, how many there might be, and how big an effect they could have in their predictions. If we suppose the correlation is just that and pretend that some new study has uncovered a previously unrecognized process that establishes a direct causal relationship to warming. All of the existing data is still exactly the same. All of the observations are identical. What has to change is the explanation and strategy. That might look something like : "X is causing a heating effect on the planet. Normally this excess heat would diffuse into the oceans at 10 to 20 times it's current rate, however, because human civilization rose during the end of a glacial melt period when the melt water made increasing land area habitable for a few thousand years, humans were able to spread to those areas. This was accelerated due to technological advancement before the warming trend dried out the inner continental areas and made them uninhabitable. During this growth period, humans released massive amounts of CO2 which has trapped much of the heat that would have already been absorbed by the oceans into the atmosphere instead. This, in turn, has slowed the effects of the heat increase on the oceans and kept the average salinity at a point where ocean currents haven't collapsed. As it is unknown how long this current heating action will continue, we are close to the ceiling on CO2 counts that are survivable for land based life, and a massive reduction in CO2 would cause a rapid heating of the oceans resulting in a backlash re-glaciation effect, our best option appears to be researching practical methods of triggering large numbers of small scale volcanic events. This will occur slowly with a few per year, over the next 100-200 years to offset further heating until the main source of thermal increase begins dropping off. " I'm not saying either theory is correct, but establishing more than a correlative, circumstantial case is required. This is true both intellectually, and in order to proceed in any effective direction, because no effective strategy can be employed with such a large portion of the population unconvinced and apathetic. We are seeing that politically in the US as we speak. The portion of the same population that is largely silent most of the time is a sleeping dragon that no hobbit can wake without severe repercussions. As i mentioned there are a bunch of things that the opposition takes issue with and the apathetic aren't motivated by. Those need to be addressed sufficiently to either reinforce the current theory or, if they don't, give a clearer picture so a better theory can be established. We need a much closer examination of world ocean data. Tracking of temperatures current speeds, salinity, etc mapped onto the atmospheric data if it produces a matching correlation, would go most of the way. We need to address the issue of CO2 being the weakest greenhouse gas and understand what happens when petrol is replaced by an increase in water vapor from the increase in Coal or nuclear use with battery charging. What effect the additional water vapor release will have on temperatures, since it has a much greater greenhouse effect per litre than CO2, is a big hole in the petroleum elimination part of the current plans.
@@mrnobody2873 : The actual affect of infrared on CO2, the re-emitting of that energy into the surroundings, the increase of CO2 by half and the fact that it lingers for hundreds of years are not just correlated. Increases in industrial CO2 are causing global warming. It is measurable and predictable and well-understood for a hundred years. CO2 is the temperature regulator, water vapor is the feedback mechanism.
You “forgot” to include a longer period graph. I put together a graph going back hundreds of thousands of years with public ice core data from NOAA and what we are seeing now is very stable in that context. I take the sudden spike to be a function of switching from extrapolated data to observed data with better resolution.
Michael Mann deliberately his the decline & if you take the time to do some research you will realize that what he did was deliberate & means to justify his projected prejudices in favour of global warming.
You're parroting a long debunked slander of Mann. This was a false accusation that was thoroughly investigated and debunked. The terminology was taken out of context and its meaning misrepresented by fossil fuel shills.
@@lrvogt1257 Mann deliberately hid the decline in temperature - why would he do that? Might I suggest you listen to Dr Patrick Moore podcasts in which he totally destroys Mann's computer projections. In my world especially living in the UK I for one of many would welcome some extended periods of global warming during the Summer season.
@@williammurray3840 : Mann absolutely did not say or do that. The decline had to do with tree rings at certain altitudes diverging from the instrumental record after 1960. It wasn't about temperature but about tree rings. This was investigated by a dozen groups official and the press and found to be a baseless accusation... as I explained earlier. When questioned about Patrick Moore's book, those he referenced and quoted say he misrepresented their work. He's a shill.
And yet if you watch the video his hockey stick does just the opposite, it doesn't show how far global warming has gone beyond anything Earth has seen since *before the last ice age.*
The graph can be both accurate and misleading. The Y axis shows the average change in temperature with a range of +1 to -1. The same data showing the actual average temperature would show a much less impressive graph of temps ranging from about 13.6 to 13.9. Reducing pollution is a good thing but the drive to instill panic and prompt irrational action is not.
Well said. But it also avoids many dishonest and disgusting facts about the graph and the people compiling it which is now public record. Its a laughable video. The graph was cut out in the 60s or 70s them user proxy data using two sources at the time a 30 plus year cooling period ended so the spike looked increased. The tree rings weren't meant to be used for temperature at all according to those who took them and Mann took out those which showed the opposite so as the average would fit his goal. Then though on a public pay role he refused a FOI and refused to show his methodology to other researchers. When the end of the world is around the corner!
Something that is overlooked is that life, from plants to fungi to mammals, have an easier and more successful time adapting to warmer climate than to cooler climate. In simple terms, it’s easier to dissipate heat through already existing systems, like sweat pores, than to develop new warmth retaining mechanisms, like humans or birds developing blubber layers. Warming isn’t the end. Or rather, it’s mot as certainly the end as a drop in temperature would be. For a real world, real time evidentiary example, compare Texas heatwaves to that cold snap they had. You barely hear about their heatwaves. They’re easy to adapt to, even months long or multi-year lengths. Imagine in contrast if that cold snap they had lasted 18 months. 2C warmer is better than 2C colder. And a sudden and decades lasting 3C-6C drop from a single sizable volcanic eruption could happen in any given year. That eruption is coming. A mild 2C raise now will offset the drop, and will be less catastrophic and more survivable for every creature everywhere. This forward looking plan is not discussed, as people are focused on immediate effect, and not accounting for unavoidable eventual factors. We can plan for that drop, and maybe cut it in half, there y saving 60-70% of the global population from freezing to death. No one wants to listen to rational minds, and consider the elephant in the room. They’re too caught up in hysterics of rising temps. The real threat is the floor being pulled out from under us, and our unintentional exacerbation of that.
Good post. As for your Texas example the reason you don't hear about their heat waves (In my onion) is it is expected. Right now we are hearing about how cold Fla is. Yet people are not talking about the temperature here in Western NY. That's to be expected. Is there climate change going on? I honestly don't know. I don't know your age but I'm old enough I was around during the 70's and 80's when we were warned that a new ice age was coming. Then we get warned the planet is heating up, global warming was coming. Then we get told that global warming will trigger an Ice age. Then they change it to climate change so no matter what happens they can say they were right, the climate changed. The other thing they do is when we have heat waves they say that it's proof of warming. But if we point out the especially cold winter we just had they say that's weather not climate. You can't have it both way. Is the weather different from when I was a kid. I can say yes. In the 60's and 70's I was playing in the snow at Thanksgiving and we always had a white Christmas. The first day of deer season had snow. Now there are many times when we don't have snow for those times. The funny thing is they started talking about Warming not long after they had warned of the Ice age. So why am I doubter? It's because of what I have seen over the years. I'm not a denier, it's possible. I'm just doubting what is being brought forward. I know I am a boomer, but I enjoy being called that. Why? He was one of my favorite characters on TOS Battlestar Galactical. I just noticed autocorrect wonderful of my misspelling of opinion. It changed to onion. I'm leaving it so you can have a laugh. Keep your onions to yourself
@@notacommie7154 I can agree with you the people pushing it are doing it for that reason. But I have some left leaning friends(Hell leaning so far left they landed on their face) that believe this stuff because that's what they have been around for so long. And condition to not accept your statement without you giving your source so they can point out why that information is wrong.
And just take a closer look at the numbers. Even at the most extreme error bars, the range of change is less than 2 degrees for the whole of the last 1000 years. And the mean average by less than 0.5 degrees over the same time. To thikn we can change that within a single lifetime is laughable.
I watched this on Nebula, and I just gotta say at 9:20 when you emphasised how we know more about climate change than ever "so can we please fix this" just before ending the video was heartbreaking. Great video! Can we please fix this
Just leave it alone,trying to fix it in the middle of a pandemic when you have enough on your plate is already making people's lives worse ,with 15%inflation,QE,etc,there are no rising oceans,no increase in cyclones ,only unprecedented scare mongering by the media and politicians who are already factoring in a 28 dollars a ton carbon tax,and now we have an energy crisis because we are trying to transition too soon,you can't make this shit up!
One degree Celsius. How much benefit has mankind gained from the burning of fossil fuels, and how much loss has and will it incur from this perversion from what nature presumably would have set our thermostat at? Don't just "do something" without answering these questions. There is a cost benefit analysis required before every wise act taken. Don't just assume that warming is all bad, or that a trend is not naturally regulated by some as yet unrealized feedback loop.
So it's a lovely hot year but you get no rain, how the hell does that translate as a warm year when there is no growth. If it was a 3 or 4 year drought it might show up as a band but that might also be indicative of a cold period where the tree simply didn't grow. Cell size might be a useful filter but again a wet cooler year will grow as well as a warm dryer year. The measurements taken by Mann were for the northern hemisphere and yet he included data from Tasmania? This is not science, it's witchcraft.
Dude, Bayesian modeling is so fun ( 6:10 ), I just started using it in my phd work (experimental plasma physics, nuclear fusion) to predict uncertainties from our models, and it literally feels like magic to be given error bars and basically an explanation for the chosen minimum your script pops out. Thank goodness for modern supercomputers cause it takes Forever to run, but so exciting that it's getting used in climate science!
Bayesian modelling looks good on paper, and in an academic environment. In a real world consumer products sales forecasting environment it doesn't work at all. I've spent years trying. I appreciate your enthusiasm, but it's nothing but theory and I have never seen the theory equate to reality in the long term. It works great for short term forecasting. It completely fails at long term forecasting. Climate is long term forecasting. If you want accurate weather forecasting for the next 3 or 4 days, Bayesian models work great. If you want to forecast the weather/climate for the next 80 or so years? Not so much.
Yes, you missed what the scientists were saying then, what they've said since, and what they're saying now. In other words, you didn't miss something. You missed everything.
Simon, that brilliant 7 year to put together model, with all “The proxy’s”, does it forecast climate? Who commissioned and paid for it? And does it still show a total of 0.8 degrees of warming for the 20th. Century and a slight cooling over the last 30 years?
Is this supposed to be some sort of conspiracy-type gotcha question? Or a legitimate inquiry for this information? You do realize Simon puts every study he references in the description right? Surely if you wanted this for informational purposes you'd have found that but if you still want those answers, by all means, read the studies. They will either impress you or you will ignore their conclusion because it doesn't match with what you want. There is no in between.
@@Chris-io2cs There appears to be a lot in between "impress" and "ignore." It is quite valid to examine any statistical research, as there are dozens of forms of bias possible in any scientific study. Each study should be evaluated based on its assumptions, limitations of scope, and how applicable it is in applying to a larger population. I'm sure you're aware of this.
@@danielmatthews1522 a little off-topic to bring up the scientific process no? I thought it was pretty clear I was observing and pointing out the flaw and questioning his intentions rather than actually proposing that no single person could do anything but agree or disagree with a study. I'm actually curious why you thought of latching on to something so specific I said like that. It's not an uncommon rhetorical technique usually designed when you see hints of sarcasm to try label the opposition as someone who shouldn't be taken seriously but I can't help but feel you actually think that the only person here acknowledging the reference studies doesn't understand why we need studies rather than just implying it for a slight argumentative gain.
@@Chris-io2cs I would say you came down on him, fine, but then highlighted, a bit condescendingly perhaps, that if he didn't get impressed it meant he must be "ignoring it because it wasn't what he wanted". That was what I was confronting. I just think each study is open to being questioned, evaluated, etc, I'm sure you agree, and that one isn't obligated to take anything at face value. The "because it wasn't what you want" appeared to be an attempt to shame him for questioning the study, perhaps that was not your intention. There is far less actual debate of science going on for environmental topics, and shame and, as you noted, rhetoric, are often substituted.
@@danielmatthews1522 ok fair enough, I'd agree that I wasn't giving him a fair chance and just assuming that he was his intentions were bad. I could still be right about that part, but it's fair to said I took a needlessly condescending approach. I think we both agree that we should continue to research and definitely question that research rather than just take a side.
@@hosnimubarak8869 Little Ice Age or Maunder Minimum was a result of a Grand Solar Minimum. Michael Man is a proven liar. He claimed he was given a Noble Prize and even made up a dodgy one for his wall. He didn't receive one.
@@barrybloggs9474 You're an idiot. The Little Ice Age (which was not a true ice age). It was a period of cooling that occurred after an especially massive tropical volcanic eruption in 1257, of the now-extinct Mount Samalas near Mount Rinjani, both in Lombok, Indonesia, followed by three smaller eruptions in 1268, 1275, and 1284. When a volcano erupts, its ash reaches high into the atmosphere and can spread to cover the whole earth. The ash cloud blocks out some of the incoming solar radiation, leading to worldwide cooling. Also emitted by eruptions is sulfur, in the form of sulfur dioxide gas. When it reaches the stratosphere, it turns into sulfuric acid particles, which reflect the sun's rays, further reducing the amount of radiation reaching Earth's surface The Sporer Minimum (1450-1540) and the Maunder Minimum (1645-1715). Both solar minimums coincided with (but did not cause) the coldest years of the Little Ice Age in parts of Europe.
Glaring omission: For tens of thousands of years the proxy data shows that CO2 level increases have lagged behind temperature increases by from 800 to several thousand years. Thus, rising temperatures cause an increase in CO2 levels. Most CO2 not locked up in plants, is in ocean water. Rising temperatures caused greater plant growth, and dying vegetation releases CO2, but the vast bulk of CO2 was released from the oceans when the water warmed.
I would've liked you to dive more into why this new study (Osman et al) should be more trusted than the older studies that showed recent cooling, for instance
Which study shows recent cooling? If you mean recent in the past 200 years these studies are quite useless, because we have exactly measured temperetur recordings for this time period and they show it is warming right now.
They actually do. A lot. Have you read any of these studies? Any climate-related ones? A study period? That's ok, 3rd hand sources written by propagandists who tell you things like "no one considers the actual fucking ball of energy in the sky when talking about how much energy the earth captures" are good too.
@@Chris-io2cs Okay, but let's recognize that the study from this video he is commenting on does not allocate any of the warming to solar causes, supporting his point.
@@danielmatthews1522 ok fine I suppose I will just concede that because this video doesn't mention it no one ever has thus justifying an off-topic red herring designed solely to undermine the credibility of the whole concept.
If we still haven't reached the temperatures or sea levels of the previous cycles it would make sense we hadn't seen these temps recently. if the earth was actually cooling for a thousand years then reversed and started warming again quickly like the previous graph then i would be much more worried. we have seen these temperatures and higher naturally the last five ice age cycles and their peaks were very short and spikey.
Ice core and sea floor mud samples show we are no where near temperature minimum or maximum over the last 400,000 years. Technically speaking we are still coming out of the last ice age from 12000 years ago. That isn’t that last ago in overall age of the earth. Climate change is inevitable and not an emergency. Irreversible environmental change like deforestation, resource depletion,strip mining, etc is the problem but climate change is “proxy measurement” used to address it and its doing a terrible job at it. Until we get money out of the renewable energy sector and approach ever industry that doesn’t have a sustainable element to it or an ability to reuse or repurpose its resources-our planet is dead
That, ladies and gents, is what we call bulls*** 😌 CO2 and methane are greenhouse gases and keep long and short-wave radiation bottled in the lower troposphere, raising global temperatures, including surface temperatures. We KNOW that’s a scientific fact. The burning of fossil fuels releases a measurable amount of CO2 into the atmosphere. Methane from livestock operations also is measurable. When the earth warms as a result of this, it creates a positive feedback loop: because as the earth warms, it melts more ice (some of which releases even more methane), and reduces earth’s albedo (reflectivity), along with other positive feedback measures, which further warms the earth and so on. The sudden punctuated rising of temperature with this latest “hockey stick” shows very clearly that there was relatively consistent global temps right up until the industrial revolution, in which humans have been pumping greenhouse gases into the atmosphere like no tomorrow. TLDR: Yes, I am worried. Because the science shows troubling warming trends, 1,000s of people are dying around the world right now due to this warming, and leads to drought. So yes, I am worried. You should be too.
The big driver for the last three million years has been the Milankovic cycles. This an orbital "wobble" that repeats every 120,000 years. When closer, things warm a little, at the other end, things are a bit cold. We are a little past the very warmest bit of that cycle by only a thousand or so years and can expect things to cool by a degree every five thousand years or so. Instead we gained a degree in a century. Over the two or three million years covered by the Vostok cores, CO2 never exceeded 300ppm. We are 50% higher. with a known physical mechanism tying CO2 to heat retention. Could be some clues there.
@@aaroncosier735 There’s never been a time in history when a person couldn’t cherry pick some data to prove any point they feel like. Stop feeling like a climate liar. The Mayas are extinct because of a crazy drought hundreds of years ago before any fossil fuel or man made pollution. Just stop already with your lies!
You can't honestly still be promoting that long-debunked slander. It was a totally false and dishonest characterization of Mann's work which was investigated by a dozen official and journalistic organizations and found to be bogus.
@@bcwbcw3741 really, when the author references multiple documents and articles and provides links to them so you can read them and get the full context. Also provides links to all the studies and reports cited in their work. Does that not constitute at least reasonably good documentation?
@@racetime1960 If you want to understand whether your "good documentation" is any good you should start by looking at the papers that disagree with your "refutation," not the self serving citations in these papers that agree with the authors. Unless you can understand the papers that disagree and show how they are wrong then your refutation is meaningless. The mechanism of heat trapping by CO2 is well understood, unless you can show how that additional trapping can take place and not change the earth's temperature then you haven't refuted anything.
@@bcwbcw3741 or you can explain how the atmosphere is big enough and complex enough that CO2, comprising a very small percentage of the atmospheric gases won't have that great an effect on the planets temperature. And, if you realise that none of the predictive climate models work in the end and that none of the doomsday predictions has come about. Oh, and the papers you say I should read are cited and links provided to the documents in question. See, it's not that hard, with just a little effort, to understand that the "climate catastrophe" is in fact a fairytale.
The top "climategate" video on RUclips is presently a Cato Institute talking head on Fox News. So yes, please make something to fill this particular data void.
Reanalysis is still flawed if the input proxies are not good. There is still no good explanation as to why the medieval warm period was local when it may have stretched half way across the northern hemisphere. So why does the reanalysis not explain how barley was grown in Greenland? In any case, why do we think that a bit of warming is a bad thing and that the current condition is optimum?
I don't like it when two different methods to measure the same thing give different results where their error bars don't at least come close. It basicly means that at least one of the methods has something wrong.
Don't worry, NASA and other broken US institutions will do their part to make whatever outcome the politicians want. So sad to see people fall for this crap continuously. When the East Anglia emails were leaked (discussing how best to fake data since none of the predictions were panning out), the British government told the world that the emails and their contents didn't count or didn't exist because they were stolen (hacked). If that is "British Common Sense" then those people have none.
The elimination of the MWP and EMP variations weren't mistakes due to data interpretation, they were an outright and fraudulent attempt to deceive and make modern variations seem more significant. It is also extremely short-sighted to surmise that warmth (temperature) is the only thing that affects the width of tree ring bands, as they are also affected significantly by other characteristics of the climate, such as moisture, the amount of actual sunlight received, and the amount of nutrients (mostly C02 and nitrogen) available in the atmosphere.
'The elimination of the MWP and EMP variations weren't mistakes due to data interpretation, they were an outright and fraudulent attempt to deceive and make modern variations seem more significant.' The MWP variation was never eliminated, let alone fraudulently, because there was never any substantial evidence of its existence globally. Simon Clark mistakenly presents the graph at 3:47 showing a pronounced Medieval Warm Period as a global record. It is in fact an approximation of temperatures in Central England from Lamb 1965, using historical documents and vineyard distribution. Thus not only does it represent a very small area (Lamb himself thought the Medieval Warm Period was a largely European phenomenon) its methods are thin compared to the huge amount of evidence that has accumulated since, or even compared to MBH 99. 'It is also extremely short-sighted to surmise that warmth (temperature) is the only thing that affects the width of tree ring bands.' It is true that there are uncertainties, which dendrologists are well aware of. But the reliability of tree rings as proxies to a fair degree is confirmed by the fact that they correlate with the surface temperature record from 1850 up until around 1980 (after which there is the divergence problem). They are also roughly confirmed by any number of other proxies such as corals, boreholes, stalagmites and ice cores. Here is something of an explanation. For the confounding factors you name, CO2 levels were very stable over the past 1000 years up until around 1900. Nitrogen (which plants get from the soil) would also be fairly stable in uncultivated areas. So it is unlikely these have confounded the record. As for rainfall and sunshine, apparently rainfall is a bigger factor while sunshine plays a smaller role. Dendrologists reduce uncertainty regarding rainfall by going to the upper slopes of mountains for temperature variation (since rainfall is likely to be in excess). Botanical experiments can also be conducted to isolate the effects of variables like rainfall and sunshine.
My pumpkins agree entirely and so do my tomatoes. This year has been pure crap for the tomatoes but the pumpkins are headed for the Guiness book of records - god knows why. More important perhaps - the half life of atmospheric CO2 is a mere 13 or so years. If it were man made we would see significant fluctuations in the levels and strong regional effects but we observe neither - implying (as several studies of historical data have also concluded) it is more likely to be the consequence of global warming than a major cause. There are other well known causes of regional and global warming that are always ignored: one of them is atmospheric particulates and sulphur oxides. These were reduced by the switch froom coal to oil, reduced again by Clean Air Acts around the world, reduced again by catalytic converters and finally reduced once again by deindustrialisation - especially in the north Atlantic. We therefore have a very neat irony in that the only mechanism that can be clearly linked to warmer temperatures is climate change hysteria.
@@kilometreman Also, the original Lamb diagram in the first IPCC report did not have any numbers on the temperature scale. It was described as a 'schematic' not a quantitative graph and was for central England, not the globe.


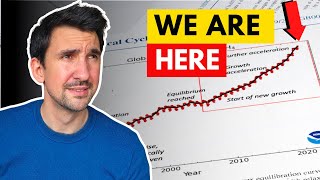


Climate gate video would be great, I find the history of science controversies (and reactions to research at the time) fascinating
Potholer54 has done a video about "climategate".
@@Stealthbong several actually.
Yup and it's mostly bunk....meaning it's been used incorrectly and to try and deny madmade climate change.
@@Stratosarge Unfortunately, Potholer54's videos are not favored by the algorithm, so few people actually see them.
@@BladeValant546 madmade? 🤔
Simon: "This graph is wrong"
Me: "Please be good news. Please be good news. Please be good news. DAMN IT!"
The good news is that the prevailing scientific view of climate change is correct. The bad news is that people have to do something about it.
It is good news. It further supports the conclusion that something needs to be done, in a much more visually striking way, and so makes it much harder for deniers to keep denying reality. If this news hadn't come out, the deniers would stand on slightly less shaky ground. Now they're wobbling really bad, and the onlookers will be noticing. There's not much room left for deniers to look like reasonable people, and so the numbers of deniers will decline further.
I say that because I also used to deny the human contribution to global warming. At some point that denial becomes too absurd in the face of the evidence.
@@ETBrooD hey good on you for accepting human-induced climate change, even if it is something thats really awful to have to accept.
i agree with the rest of your comment as well. the more proof we have of climate change, the more people will believe that its real, the higher the demand to do something about it
@@LisaBeergutHolst
It's exactly the other way around.
@@ETBrooD
Nope. It only proves the fact the alarmists still want to explain the 5 billon years old history of earths climate by just looking at the past 200 years. Which is totally stupid.
*“You can’t go back and change the beginning, but you can start where you are and change the ending...”*
*―C. S. Lewis*
"nothing ever ends adrian"
Using Christian theology to usher in radical socialism. Cute.
@@PD-we8vf .. what?
Great quote
Look out. You used a quote from a Christians author... Get ready for some hate and vitriol from strangers.
Three things we do know about the MWP is that there were three crop rotations a year, vineyards thrived from Scotland to Cornwall, and the skeletons of the period indicate that even the very poorest people were eating exceptionally well in contrast to evidence from skeletons before and after that period. Historical records also state the poor were able to live comfortably outside in rough shelters and evidence of ancient houses that still stand today show us clues that it was a very warm period indeed. Well I not sure about the rest of the world, but certainly in Northern Europe the temperature was certainly significantly higher in the MWP than today for those factors to occur. Try growing vineyards in Scotland today or achieving three crop rotations per year and see how far you get.
We also know that 6000 years ago the Arctic was free of sea ice. Regional? There are 2 castles, I believe, that were built around 1200 AD with ocean docks. Those docks are now very far from the ocean because sea level was much higher in 1200 AD. Regional? THe Sahara was green 7000 years ago. Regional? If you take a bunch of proxies and average them out, won't their own lack of resolution cancel eachother out? Seems like you could make any data into a hockey stick that way.
@@johnkosowski3321 Exactly! It all comes down to natural cycles, including the four Milankovitch cycles and of course solar activity.
@@johnkosowski3321 "If you take a bunch of proxies and average them out, won't their own lack of resolution cancel each other out?"
Yes, that is very much what happens. And is how Mann got his hockey "stick" to be so straight.
Stop being silly. These mischievous manufactured contrarian narratives comprising of half truths, outright nonsense, fallacious arguments and irrelevant talking points are getting old and tired now. Boring in fact.
It's hilarious how the AGW contrarian style has evolved from the full head on beligerence model, to instead relatively recently, trying to sound knowledgeable, resonable and considered as if they know anything remotely useful about the topic.
Yep, you all look like sealions to me.
@@jamesfairmind2247 Recent rapid global warming is NOT the result of "natural cycles". Both long term Milankovitch and recent solar changes should have caused slight cooling over the last fifty years or so, NOT the observed rapid warming.
The use of tree rings as a proxy for temperature is problematic because tree ring widths are more influenced by the regularity of rainfall not temperature.
all proxies are problematic; tree rings are more effective as proxies in some regions than in others, and this is also why multiple proxies are used - as explained in the video.
@@Sa1d1n Tree ring growth is effected by the regularity of rainfall and sunlight. So large rings are produced in hot and cold years. Small rings are produced in hot and cold years. Where in the world are these basic facts not true? Were the samples taken for the analysis from only those locations? What and where is the proof of that? Also the vast majority of the analysis is based on tree rings making the other proxies used rather irrelevant. If you are going to use a proxy you need to use it throughout time not just to fill in for missing data.
@@Camerondes21 depending on tree species and location, tree rings may be predominantly rainfall-limiting or temperature-limiting. This helps you determine (with reasonable accuracy) what the contributing factor to the growth pattern is. Of course, this works better in some areas than others. This is why you use other proxies (e.g. Isotope analysis) to interrogate the rainfall and/or temperature patterns for the particular region and the particular time period under investigation.
Tree ring widths are caused by si light and rain fall. Which are caused by temperature differences.
Huh? The temperature of the earth affects sunlight? That’s backwards.
So after doing some reading the scientists don't just use Tree Rings, they also follow it up with other proxies:
- Chemical properties of fossilized remains of plankton and microbes in sediments where the age is known from radiocarbon dating
- Ice drilled from polar regions
- Stalagmites in caves
- Sediment cores - Sediment laminations, or layers, can indicate sedimentation rate through time
Despite being predominantly recorded in Europe, south-western North America and in some tropical regions, the Medieval warm period affected both the northern and southern hemispheres. But the temperature increase was not universal, varying across regions of the world, and did not happen simultaneously everywhere.
@@paulsnow In the Roman warm periods Julius Caesar wrote about the fine wines coming from England some of which came from as far north as Carlisle, It is only now that wine is being made again in the UK and that is only in the south.
"Mediaeval warm period" is really short localised warm periods that are not simultaneous, but spread across about 500 years. It's an artifact of deliberate sampling bias.
@@paulsnow What makes you say the South Pole isn't warming?
@@paulsnow "raw" means inaccurate.
@@paulsnow If I collect population height data from 3 different countries, the raw data is useless: Country A measurements are done in inches, Country B is done in cm, and Country C is done in cm using rulers that are known to have expanded due to the heat.
The data first has to be homogenised so it is all equivalent.
Scientists know this.
Dimwit dropouts don't know this.
Excellent explanation - I love the monkey analogy! It's amazing how a 20 year old graph is still so relevant today. Also yes please for a climate-gate video - it's a conspiracy theory which refuses to die!
Well when the time scale is so wide, usually it takes a lot of time for any graph to be come dated
@@craigscott2315 "When everest popped the siberian continent move 2000 miles in seconds" - What on earth are you talking about?
“The Guardian” has a great article about Climategate from 2019.
@@craigscott2315 the moon is flat and When the sun was eaten by a dinosaur 5000 years ago, an apple exploded. Also, red is my favorite color in the alphabet, from a chart from 1-10. The universe was debunked in the faked moonlanding in the century of pears, more exactly on the date black holes. Mind the monkey! In China, a bag of rice just tilted over, and my only infinite amount of toes just cried. Now my phone is sleeping. My RUclips-Channel died yesterday and I was just to it’s funeral. REFERENCES/SOURCES:
1. logic
2. common knowledge and common sense
3. J.F. Kennedy
4. T-Rex
Happy easter!
@@craigscott2315 global warming hadn’t even really started in 1886 since temperature measurements first started about 6 years before that! And how do you debunk the temperature of the coming century, a century earlier?
Anyone else find it interesting that almost all the SST proxy data points were coastal? Seems like that would make a big difference.
Not really. Their model would certainly account for that using the current data.
Reports actually point out that the data varies, and so long as you point out that variance in the paper, it doesn't invalidate the data. Interesting little twist to scientific papers isn't it? Sort of like when I declare I became a millionaire on social media pages a few years ago, but realize it is because I stopped using Euros as a valuation and instead started counting my net worth in Pesos right about that time. Hrm.
Most remote weather collecting data stations from rural or remote locations (which tend to have more stable temperature ranges over time) have been deprecated (removed or no longer included in date) over the decades. And those in urban locales e.g. major metropolitan cities (which have more consistently warming temp changes) have increased many fold. This is also pointed out in the paper as to why there is a warming trend. but...CO2!! CO2!! CO2!! It's now getting in the eggs! So feed your kids breakfast cereal! It's healthy for them!!! So sayeth the main stream media and your government....so let it be done. Amen.
@@schrenk-d would or did?
the fun part of statistics is that you can greatly influence the overall picture by manipulating small sets of variables
@@SickPrid3 but the idea is to find out the data - the truth. Not to manipulate the data to deceive people.
These climate alarmists have many ways to lie with statistics. CO2 levels have increased by only 1.29 parts per 10,000 since 1880. Tiny! Insignificant! Nothing cannot cause something. That's how you realize that CO2 climate change is a big lie.
In a fairly publicized lawsuit, Michael Mann REFUSED to hand over the data for the hockey stick chart to prove his side. Mann lost the lawsuit. You should hold anything he trots out with a high degree of suspicion.
I hold out with a great degree of suspicion anything that confirms the narrative you have almost no choice but to confirm. If any climate scientist went against it even a little, they would likely lose their livelihood. Follow the incentives. It makes it almost impossible to understand any other climate stuff, because both sides seem out of their minds.
Can you provide a source for where Michael Mann refused to hand over data because I here that the controversy came from people analysing the same data and coming up with a different graph?
Mann has already won and will continue to, and no evidence can even dispute the hockey stick.
The hockey stick is exactly correct.
@@dougcard5241 no
It’s curious that Michael Mann is so reluctant to defend his hockey stick in court. He started the cases but has refused to complete them.
Not True, he lost a court case and the Judge told him his graph was fake!
So the Tim Ball case and Mark Steyn case didn’t happen ? He just refuses to give his evidence after he sues people.
You mean: the "scientist" who faked a Nobel Peace Prize award on the door of his office wouldn't defend his work? You must be wrong.
That's because the entire climate study field is based on fraud. I've made a startling realization that completely guts everything we have been told.
@@notacommie7154 If you had actually read the experiments and studies done in the last 20 years or so, you'd know how utterly foolish you sound.
There is a lot of interest in what is going on, and only very specific areas have higher degrees of certainty. There is still a LOT to learn. The problem isn't the scientists.. it is politicians + agenda driven media supporting those politicians. You'll never find any time when all scientists agreed, and there has never been a time when there were not dishonest scientists. Why should today look any different?
What about the Roman Warm Period? I believe the RWP was even warmer than present day temperatures. Using tree rings to determine global temperatures is ridiculous. Drought years are small, wet years are bigger. Once while cutting firewood on my property, I counted back on the tree rings to the winter of 1968-69 - it was very big because that was an extremely wet year - and it was a cooler than usual winter. And good luck finding trees going back to the RWP.
Roman, Viking, Medieval warm periods... all of that was regional not global.
@@lrvogt1257 From what I’ve read the RWP was more global than the MWP. Both periods had temperatures as warm or warmer for periods of time. The main takeaway with climate science is the constant, often erratic, change - even when humans can’t be blamed. The Russian and Japanese climate models are reaching far different conclusions than the models our government is using. The fact that trillions of dollars are at stake with this climate warming issue and the fact that our present government is corrupt to the bone makes me wish I could find another planet. The fewer humans, the better.
The problem with the hockey stick graph is that it stops using the tree ring data at about a century ago because the hockey stick doesn't show up in it.
what about the other models showing a very similar graph? The ones not only using tree-ring data
There's multiple problems with that graph starting with the time frame it covers considering the Earth is billions of year's old. Humans really have no business talking about what's normal climate patterns for Earth when they know so little. The fact is Humans are a part of the ecosystem & its humans job to focus on human preservation. The Earth doesn't need humans because it does what it wants. People that have traveled in a plane & looked out the window can see how minuscule the effect humans have on Earth. What we are dealing with is phycological manipulation on a massive scale. Its not new because in ancient times they'd cut off peoples heads in hopes it would please the Gods & bring them rain. The Global Warming/Climate Change crowd are a cult. If you want to know the limits of human ability on Earth just go research Wars. If humans could have any influence on the Climate they would have already weaponized it.
@@TheEhrnberg The problem is that they are models, not direct temperature readings of the average temperature of the Earth's atmosphere.
@@wandameadows5736 What if we do nothing and then we have a better understanding later on then realize it's too late. What if we do something and head towards a cleaner more sustainable future. I know which one I would pick. You yourself state that we don't know if we are having an impact on the climate. I'm unclear on how you are able to state that climate change crowd is just a cult following. Your statements are contradictory at best.
@@wandameadows5736 So, your comment lacks in multiple ways.
First of, abnormalities like a sudden consistent spike of global temperature is a good reason to question and analyze the whys. With regards to this issue, the industrialization and the consequent emission of greenhouse gases has proven to be an overall coherent theory. In contrast the theories of climate change deniers, which dont explain this occurence at all, it has managed to connect results from a vast amount of different research areas (such as mentioned in this video) while
persisting.
Secondly you can very much see human impact from a plane, such as the shaping of land into parcells.
Thirdly, influence doesnt translate into control by default. Just because you can have an effect on something doesnt mean you have a way to turn it into a tool for your own use. But projects are working on WEATHER control (not CLIMATE), that i can assure you off. No proof cause really you google weather manipulation research and you find something
Finally, do you believe factory and car exhaust fumes just vanish into non existence? Habe you ever fancied taking a good sniff from your exhaust pipe?
No? Well, perhaps that is because it is indeed a form of so called pollution which is harmful to our species and others.
But sure its easier to ignore reality when it doesnt suit us, so we can comfort ourselves into keeping our established habits, avoiding burdening our conscience. Blame it on a scheme and off the hook you are.
Oh hi, nice Nebula original pick 😁
Also, great video as always
If I had time to watch more videos, I might get Nebula for Not Just Bikes and Real Engineering and Mustard.
So, what was the global climate like between the glacial maximums? What was the global climate at the last glacial minimum (what we are currently heading towards or at)? How does maximum and minimum glacial loading effect the Earth's climate?
Michael Mann put up this fraudulent graph to get his Ph.D. I know my PhD thesis is not any better, we all cheat to get degree, but at least I stop talking about my fraud after I got my PhD.
Wdym by “maximum” and we are heading towards a hot house climate. Something our planet hasn’t seen in millions of years.
@@dallasguy236 and sea levels in the Eemain interglacial 125,000 years ago, yes only 2-3°F warmer than the late 20th century temperatures, caused sea levels be 6 meters higher than today.
@@PremierCCGuyMMXVIyou’re assuming that the trend will just continue to rise though
@@m_t_t_ why wouldn’t it not continue?
As soon as he said they used "scientific modelling" I shook my head.
The academic Prof Ferguson who created the infamous Imperial College model that warned Boris Johnson that, without an immediate lockdown, the coronavirus would cause 500,000 deaths and swamp the National Health Service - Never happened.
Ferguson was behind the disputed model that sparked the mass culling of eleven million sheep and cattle during the 2001 outbreak of foot-and-mouth disease and predicted 150,00 deaths from mad cow disease by 2080 - Never happened only 177 people have died.
In 2005, Ferguson's model predicted that up to 150 million people could be killed from bird flu. In the end, only 282 people died worldwide from the disease between 2003 and 2009.
In 2009, a government estimate, based on Ferguson’s advice, said a “reasonable worst-case scenario” was that the swine flu would lead to 65,000 British deaths. In the end, swine flu killed 457 people in the U.K.
Many of these scientists would be better off playing with model trains than "modelling" predictions that vastly over estimate what they want to predict
@@incelshateme
This isn’t an issue based around just one scientist.
@@incelshateme If it's just the one scientist, when his mistakes are so well documented that I heard about them *last year in Texas,* the real problems are the people who keep paying him.
What it missed was that the surface water temperature measurements based on NOAH data are wrong. Almost 90% of their measurement devices are in ultra close proximity to industrial wase outflow areas where the surface water temperature is almost 3X as high as the normal surface temperature that is not located within the bounds of industrial outflow. Ergo, the data is artificially high which skews the data into massively high values.
Nonsense. Non of that is true.
There are no “industrial waste outflow areas” where we monitored the highest surface temps in the Gulf of Mexico this year. As predicted, such temps caused massive hurricanes. Now Western North Carolina is destroyed and Central Florida is flooded. Happy now?
This has been discredited so many time I'm amazed any one still has the nerve to show it .
What has?
There is an obvious problem with splicing two different data sets together. If I draw a graph of last week's weather with data from the weather service, then add measurements using a thermometer which I check every hour, there will be something a kin to Michael Mann's hockey stick. Relative flat for 7 days then major fluctuations.
I'm an undergrad math student but I haven't taken any stats courses yet. Take what I say with a grain of salt.
While we would see major fluctuations with more constant and steady measurements, we would not see these fluctuations occurring only in the same direction. Using your example, we would see that we would get spikes during the day time specifically during the afternoon when it is hottest but we would also see valleys during the night when it is coolest. These, of course, would not be detected by the weather service data (if you only use daily averages) and thus the weather service data would result in the "stick" in the hockey stick. However, measuring by the hour would result in data with peaks and valleys around midday and midnight respectively. This would not result in a hockey stick shape but rather just a more spiky/sporadic straight line.
The only way we get a hockey stick shape (without the average daily temperature increasing) is if you only measured using your thermometer from the start of the day until it reaches peak temperature for only 1 day. Of course, this is bad form and is very similar to just cherry picking data as well as suffering from a small sample size (only 1 day). Now, I haven't read the study from which the hockey stick graph comes from, but I don't think it would've gotten published or received all the attention it received from the scientific community if it was using cherry picked data.
@@liambenoit5327 Those are some good comments, with the following being noted: Yes, the point the person is trying to make is that it is easy to cherry-pick and manipulate data to get a desired outcome. He doesn't really mean that his scenario is accurate.
Second, I think you over estimate the academic acceptance of that particular hockey stick; the 97% agreement argument has been debunked many times.
Third, what would be signs that academics might attempt to validate their desired outcome? You go back to past data and "adjust" them to strengthen your argument. Done. You also keep moving the goal post for your predictions to incorporate ever more actual data to minimize the effect of future variation and you make "improvements" to the model. Done. If we keep making "improvements" to models, that means that past models were flawed. And it also probably means that the whole model continues to be flawed. When do you stop and say that your model is THE one that makes the correct predictions?
Third, you underappreciate the effect of funding to bias academics. These people's livelihoods are tied to bringing in federal and public-sphere grants and funding. Why would they show results that counter their paychecks? The other awful result is the bias in selecting research to be published. I've encountered this in my own publications. Journals are biased to select research that confirms current trends and methods, but not research that would result in, essentially, no hypothesis conclusion except to say they don't observe the same results and point out flaws of current research.
They probably had no idea about this (sarcasm)
@@FergusScotchman That's some impressive devotion and commitment towards delivering FUD there Fergus! Good old FUD, the AGW contrarians best friend.
The elephant in the room is increased solar radiation. The evidence exists that the sun has made very great impacts upon earth's temperatures. It would be good to see a chart on that.
He won't. He built his entire life and channel on this fraud.
not really at all, solar radiation and cycles are, in cosmic terms, incredibly consistent and predictable, and have been shown over and over again to have next to no effect on Earth's climate in any way that can be clearly measured. or.... unless you're not actually asking/wondering, and are instead speaking in bad faith and are just hell bent on refusing easily observable fact... admittedly I have a hard time telling the difference sometimes
Solar radiation actually decreased as temperatures rose. The data is easily available.
99.99% of the temperature on earth is caused by the sun. If anyone points this out though they are pillioried for Not Thinking The Current Thing.
@@davelowe1977 of course the sun is the source of energy but it has been very consistent. It has even decreased in strength somewhat as the temperature rose. The 50% increase in co2 traps more of the suns energy so THAT is the cause of this global warming.
The Hockey stick graph shows two different kinds of data. There are modern thermometer readings with high accuracy, regular and frequent records and good geographical coverage. Then there are proxies which are the opposite. The proxy data is easy to find via PAGES12K (the metadata spreadsheet) and graphing up any dozen of the 1300 proxies will show huge variability even for the same places using similar methods. The graph you are shown is just lots of estimates added together. The likely +/- indicates a warm era like ours would be expected every few centuries.
The IPCC best estimate for human warming is currently 1.07C. However the first 0.5C is just a return to normal after the Little Ice Age. So we are all supposed to panic over 0.6C above normal after 150 years.
The obvious conclusion is that we are having a small effect on something that isn't that big in the first place. It might be a problem if we don't change for a few centuries but there is no reason to assume any crisis is going to happen.
“No reason to assume any crisis is going to happen.”
All those dead and displaced people in North Carolina after Hurricane Helene would beg to differ.
What made it a conspiracy is their active refusal to provide access to their data, and when they did provide data, it was clear they had intentionally altered the datasets. Yes, "cleaning" data is a thing and can be valid, because some data can be in error or is spoiled in various ways, but they actively opposed investigating this. Yes, you also release the bad data and explain why it is bad, you don't hide it and lie about it. Their unscientific behavior rightfully led to questioning the validity of the graph. Note that nothing I said discussed the validity of the graph itself, just the bad behavior of Mann and Company was a strong driver of the controversy. Good scientists don't refuse to release full datasets.
And they cherry picked data and papers. They claimed the majority of papers say humans were a cause, but the reality is they excluded papers thst didn't mention humans, and so few papers explicitly said humans were not a cause.
The great majority of papers on causes of climate change didn't mention humans because humans aren't relevant to it.
So it's a subset of a subset where they rules put the majority.
You're wrong in the most important part: it's a completely fraud just like this video. I love how youtube push anti science ideological videos like this pretending to be controversial that shine new light but in the end it is just repeating the mainstream lies.
"Good scientists don't refuse to release full datasets.".... I wouldn't have released my data to some of the groups that were demanding it be released at that time. Some of them were the epitome of 'thinktank' (even as a teenager I wondered about the scientific rigor or lack thereof of some of them). My memory is of the scientists email being hacked, and their discussions about cleaning the data being used to call them crooks. They were damned if they did, and damned if they didn't.
Why are the three comments hidden?
@@grumpy3543 because you stole them, give it back Jamal.
I attended a lecture over ten years ago where the speaker stated several scientists went back to where the ‘hockey stick blade’ started to go up. From that point forward they ignored thermometers and continued using tree ring data as had been done at the start of the ‘Hockey Stick graph. From what we were told the tree ring data continued forward on basically the same ‘level’ as the earlier data. No up tick was found. Comments as to this?
This would be a part of the Climate Gate video, so I am hoping that Simon will be bringing this up. But as someone familiar with the science and those specific studies I'll comment on this.
Direct temperature measurements are really accurate, right? We have been using them reliably pretty much from their inventions. Whenever we use alternate measurement methods they are always calibrated using direct methods, as is the case with tree ring proxies as well. So if at first direct measurement and tree-ring measurements (note that a lot more than just tree-rings were used as proxies, it is only one of the methods that were used) start to diverge, what do we do? Before the divergence the tree ring data agreed with direct measurements AND other proxies, after 1960 it went completely it's own way. So we are forced to conclude that something changed past 1960 that altered the way trees behaved during their growth seasons, causing them to skip sometimes even several growth seasons in certain areas. The most likely candidate for this is the heavy amount of aerosols that our industry used to push into the atmosphere before those emissions were curbed.
Relevant studies for this: Briffa et al. 1998, MBH 1999, D'Arrigo et al. 2008.
@@Stratosarge I have to take exception that a single graph contains both proxy and direct measurement data, where proxy data is cut off at a certain point, assuming that modern data is simply superior. Temperature instruments have their problems also, such as calibration, placement, proximity to heat sources or urban areas, poor maintenance, operator error, transcription error or fraud (can happen with proxy data too), etc. I’ve worked with enough instruments that I am quite familiar with their potential problems. The graph should include modern proxy data as well, which would show there is some other effect occurring. This would hopefully inspire others to investigate the discrepancy and explain the gaps.
@@kensurrency2564 But the discrepancy and the gaps are well documented and the dendroclimatology studies show the complete proxy data. And because all the other proxies support the instrument data, either all the other proxies along with instrumental data that is used to calibrate even the tree-ring proxy is flawed, or the tree-ring data past 1960 is flawed. And note that the tree-ring divergence problem really happens in arctic circle trees, not globally.
So the proxy data would not have been representative of the modern warming and thus it was correct to not include it in a graph that is supposed to represent the changes in climate for past 2 thousand years. All the data and the reasons for the omission are all explained in the studies, so there is no secrecy behind it either.
And your points about all the systematic and non-systematic errors on instrumental data are also something that have been thoroughly considered. The data quality control has gone through peer-review and you can check the relevant studies on GISS data FAQ. And of course if someone comes up with a better quality control, they are free to submit their methods for peer-review.
@@pauljackson2409 "Just because we don't know everything, we don't know anything" is a common science denialist mantra, be it flat earther, creationist or climate denial.
Yes, I am asking you to take the model on as much "faith" as I am asking you to take it on "faith" that 1 litre of water weighs 1 kilogram, even if only 24 out of 25 scales agree with it.
The instrumental data, the other proxies and the tree-ring data on everywhere else besides certain locations within the polar circle agree with each other. And you are asking us to dismiss the rest because one dataset happens to be different in a situation where there are numerous reasons why it would be different. So you are being dishonestly obtuse.
As to why it happens, tracking down the exact reason is impossible, but there are several plausible explanations like aerosol pollution, draughts and physical stress from the rapid warming during growth seasons. (Büntgen 2021, D'arrigo 2008)
@@pauljackson2409 Jones and Mann did not "delete data", they explained the whole thing in their studies. UK Institute of Physics did not criticize them on those studies, all the audits and future studies agreed with them. The criticism came from not cooperating with McKintyre, who was constantly pestering the CRU team.
"If as you say, that deletion was justified because of other evidence, why weren't they transparent about why they did it?"
They were transparent in the relevant studies. And again independent research teams from across the globe have confirmed their findings.
"I hold a science degree and I believe in the scientific method."
Then you seem to understand philosophy of science very poorly if you are expecting perfection in any field. Do you also dismiss theory of evolution because we don't have the full fossil record? There is always more to learn. Your whole grasping of straws and willful ignorance and intentional obtuseness comes across as childish, and very deserving of the science denier moniker.
"But if you are trying to claim that something , you don'y know what, invalidates part of your data set, but not the rest of it, then that sounds to me like special pleading, and is anti-science."
It would, if it wasn't for the rest of the evidence supporting the rest of the data-set.
"who's to say that this didn't also happen in the Medieval Warm period?"
If we did not have the rest of the proxies available you would be right. It is the exact same thing with radiometric dating, if we only had one method of dating available we would not be able to use it, as it would be constantly giving us false dates. That is why we have converging evidence from multiple methods from which we can figure out the correct method and age range, and then we can pinpoint the actual age of the dated sample.
So if you truly have a degree, I truly worry how poorly the philosophy of science is taught as part of that education.
I feel like when I try to tell the average person what a "hockey stick" on a graph is, they don't know what I mean
What are you doing on a science video, aren't you meant to be on the self help channels 😉
@@DannyHatcherTech LMAO
It's for Americans who know about ice-hockey, if nothing else.
@@DannyHatcherTech is this joke supposed to be funny
@@lancetheking7524 depends what sense of humour you have.
I do appreciate the research and the information.
Likewise ☺️
One thing I would've liked to see your analysis on is the error bars for the new graph. Is the data from 24k - 1000 years ago carrying the same error "level" as the previous graph did for 1k - 400 years ago? is it worse? better? And by how much has the error shrunk in that second period now. How much more confidence do we have?
We have a lot more confidence as we have gotten way, way more data. After all the original study is now 22 years old.
I mean you can litterally see the error bars...
And furthermore you can´t tell in figures "how much more confidence we have", through different methods you get different results, but you can say that the methods get refined everytime. It isn´t like science is frozen in biology or other fields of study. So you can say that newer results (if they are well peer reviewed) are "better" than older results with older methods.
@@fable4315 I think you misunderstood my question. I have no doubt that the error is smaller and that the newer data is more accurate. And yes I can estimate the error bars, but as the scales on the old graph and the new graph are completely different, I can't really compare them on my screen. Hence why I said it would be helpful to know a bit more detail about the comparison between the two.
@@SuchiththaW 7:44 same scale.
And btw. if you want to know more about these errorbars just go and look up the study I think it is publicly available
@@fable4315 Ah i see what you mean now. Yes, that does show it visually, but I guess what I'm saying is, I'm science literate, I have a masters in Engineering, but lots of folks can't/won't take the time to understand these papers, so an explanation of the difference in error (both quantitatively and qualitatively, for the study) would've been useful, I think. Thank you for your help!
I must have missed something. Was proxy data validated with a new way of handling proxy data with credentials amounting to being 7 years in the processing? The end of the 25,000 year graph definitely had a vertical anomaly that has global warming possibilities but as a one step at a time person all it said to me was that what went before was indirect proxy temperature related data and what came after had direct temperature readings. In the 1960s met forecasters made serious judgements based on limited information,training and experience and the, now defunct, Bracknell met computer was being built. Now we are given a limited, but more reliable, choice of different computed models from a overload of data. It was towards the end of the 20th century that flights over the Atlantic stopped routinely passing met information in position reports and only did so as instructed to stop providing more data than was necessary. The biggest change to weather in the last 60 years is how humans can observe it. Adjectives like INCREDIBLE are for journalists not researchers who cannot live long enough to achieve results that will exclude inconvenient possibilities.
Spot on.
I can see why you'd think this, but a more accurate reading of temperature doesn't change the temperature you read, just the decimals after the point.
And there WERE accurate ways of recording temperature in the past (see: trade ships in colonial times with thermometers travelling the world and recording temperature)
It's just that the temperatures we are recording have gone up. According to your explanation we have somehow managed to significantly improve temperature recording methods, and at this trend, we can control global temperatures by getting better at recording them. If we want a colder Earth, just be less accurate?
Unfortunately, like all things, it's not that simple. That "end of the graph anomaly" looks like an anomaly that should be ignored when you zoom out to a 25,000 year scale, but when you zoom in to ~500 years you see it's a massive, constant, accelerating rise that shows no signs of stopping and exactly follows greenhouse gas emissions. We also know that humans weren't really impacting emissions pre-indistrial revolution, due to the fact that the industrial machines hadn't even been invented yet, so they couldn't be making the emissions (since they didn't exist).
Truth be told, I think your viewpoint is a good one to have that more people should use, but you also need to look closer if you want to apply it, and in this situation... You just can't. If you don't trust the dozens of credible temperature proxy recordings dating back thousands of years, you can say that, but the majority of the scientific community accepts that there is no better way to try and start recording an unrecorded past (apart from time travel, lol)
Have a great day!
@@ThatOneGoatGuy Thanks for the reply. My point was that we now have masses of temperature recordings of recorded material at recorded times. The temperatures constructed from 25000 years ago reply on deductions from what is believed to be the consequences of conditions that have ceased to exist. It shows overconfidence to believe that the graph starts and ends with the same kind of data just because it is labelled temperature.
In 1966 the senior forecaster at an airfield with a 200 feet cloud base briefed the assembled aircrew that it would clear by 1000 hours. The user audience laughed where upon the forecaster pulled out a 10 bob note and called "any takers"; the result was silence. The cloud base was still 200 feet at 1700 hours. Instead of being ridiculed the next morning for his mistake, the forecaster got a round of applause when he started with "put your money where your mouth is". That forecaster had to manually predict the future from experience and raw data off teleprinters. Now he would tell us what the more accurate computer models expected. Ask a computer about 25000 years ago and you have to give it human processed material as sensors only operate in the here and now. Computing power is a great tool for extending thought but no substitute for the same. Judgement (not AI) is a valuable quality that is not demonstrated by those who work backwards to justify their dreams instead of exploring the possiblities to discover the likely realities.
@@ThatOneGoatGuy I can't see your other comment. So replying here....
ruclips.net/video/lJxrs0v-3b0/видео.html
@@ThatOneGoatGuy here's some more information.....
ruclips.net/video/aq9gwzv6e04/видео.html
Real climate science is a great channel that goes into old news paper archives to show all the omitted data that was too inconvenient to include in the ever changing main stream graphs.
Can’t find such a channel is that an old name for this channel?
What I always love is how any time data is pulled and looking at pretty much anything. We always create a model where it essentially takes gathered data and then humans take anything they feel like to expand the data to make leaps. Then it turns out years later to be errored and not correct. How long before these new reports turn out to be off by some weird thing. Remember glaciers were supposed to completely gone 30 years ago and 50 years before then we were supposed to be going into another ice age.
"Then it turns out years later to be errored and not correct". Some past models got it right. Hausfather et al 2019, "Evaluating the Performance of Past Climate Model Projections".
Yes, scientists can be wrong, but does that mean we just give up trying to understand? Do we just throw caution to the wind and carry on with a course of action without even looking where that may lead us?
The whole mechanism of science is that of actively looking for where we may be wrong and trying to correct it. Just because scientists _can_ be wrong doesn't mean that my pet theory is right. A scientist who has devoted a good deal of her life to the understanding of something is far more likely to be right than I am.
@@Aaron628318 I’d say you are on the right track, however it needs to be stated that far far too many scientists put out their theory as fact. The peddle it as if there is no doubt. And the politicization of scientific theory is where the real problem arises. We’ve seen it in climate and biological in the last 50 years. It is even worse now because people that question these theories are now being shut down by those in power when real science should always be questioned and tested.
Yeah how long before we find out if we look at spaghetti long enough it's not just fucking dense carbohydrate molecules!? It's like Science gets better at describing things that already exist. Like the poor and than good Climate change model.
@@Aaron628318 Yes they can be wrong, especially when their livelihood hinges on the correct answer to be produced. Note that not even one of the 102+ models have even gotten close to being accurate. Also note that virtually none of the retired scientists and some of the nonpublic funded ones agree with the Mann hypothesis. Not even the IPCC says it is man caused.....................lastly even if man stopped all CO2 emissions tomorrow, nothing would change, not for hundreds of years. Unlike the claim by Gore, CO2 follows temp, not the other way around. It is really simple to prove, right in your kitchen.
I like how you left out the weighted algorithm used to calculate the data, and that without it the hockey stick disappears.
In fact, you can feed the program random data, and it will produce a hockey stick graph EVERY SINGLE TIME.
That's impossible, unless the program is weighted to give a predetermined result.
Ummm what? 😂
Strange example... Mangoes ripen and they ALL fall to the ground whether eaten by monkeys or not. Moreover, if there were variations, that would be a better proxy for how many mangos are harvested by humans and taken home to be eaten or sold. (Monkeys seldom export mangoes outside their home range.)
Almost as poor as the date sets that were changed/delected/covered up during climategate.
Mangoes that ripen and fall grow into mango trees
🧐 this is the detail that stands out?
@@mrs.w5145 Not really. I added a more serious, detailed comment right afterwards that expressed the hope that people would not just focus on inevitably misleading partial analyses that focus exclusively on particular examples of "positive" (GHG-increasing) feedback loops without also acknowledging the complex systems also feature sometimes active, sometimes latent "negative" feedback loops that simply can't be ignored but often are by the more catastrophically minded. (For example, a warmer climate is almost certainly going to be an increased-biomass world - albeit one with significant loss of genetic diversity. I appreciate that most people (myself included) would rather stick with what we've known during the entire history of our species since the end of the last glacial maximum, but a higher-biomass planet isn't exactly a catastrophic outcome...)
Since I have limited hope that governments can/will get their acts together (I worked decades in the federal public service in my own country, 🇨🇦), I'm more likely to favour additional resources going to (politically easier) adaptationist policies that are more likely to be effective than preventative/mitigating ones that governments trot out to be SEEN to be doing something...
Yes we've all seen how well the models perform and how many of their predicted outcomes have come to fruition. I'm just giddy thinking about all the next predictions that will come true.
Extreme sarcasm, right?
It's not a predictive model. It's a reconstruction model.
The only model you should follow is above the arctic circle. The melting of ice is the only parameter. What happens below the circle is just normal weather patterns.
You're being sarcastic but most of the models actually have been pretty accurate. People claiming otherwise are either cherry picking, lying about current trends, or both.
@@randyohm3445 he's being sarcastic over the stupid predictions of the coasts like NY being under water by now. Many scientific informed have made those predictions at least 10 years ago.
When I was a child I asked my father what we should do in preparation for the recent forecast of gloom and doom. His response was that the disaster never comes true and there is always a new threat imagined every 10 or 12 years because the old threat never happenes. My children can’t believe that politicians would be so corrupt and use fear to distract and to control people. In my 76 years I have observed the failure of every prediction of gloom and doom so proving my father’s observations to be correct. One day, my children will no doubt reach the same conclusion and warn their children to fear the only politicians wanting to create nuclear war.
Well Said, In the last 40 years we have had Acid Rain, Comming Ice Age, Ozone Hole, Global Warming and now Climate change + Rising sea Levels. Yet politicians buy houses next to the sea, and the worlds militaries use billions of gallons of fuel, and we are told we are causing these issues. Well if we get to a tipping point maybe we should stop wasting so much energy on the war machines. Never hear any politician saying that.
Care to be a bit more specific and state what a couple of those predictions were and when they were made? Sometimes we actually acted on dire predictions, such as pollution in the early '70s, and things got better (or were otherwise averted).
Thank God we got rid of aquanet and cheeseburger boxes in the 80's that sure saved us... And trans fats are better right? Oh no that was wrong.
The hole in the ozone layer? Serious issue, took a lot of work to fix it. Will be repaired in 2 centuries if nothing goes wrong.
Year 2000 issue? Yeah, I was there to fix it. It took us two years to prevent the biggest issues and like in many companies, we were forbidden to talk about the remaining issues and just ascribe them to generic software issues.
I think it's going to be hard to name a single scientifically verified issue that went away just by itself.
@@StCreed well holy shit, I worked on y2k issues too... Computer science is NOT environmental science... So you post is kinda gaslighty
Oh... It always bothered me that the called it "hockey stick" when they aren't that shape; they make a U at the end. They meant ice hockey stick... That penny took a long time to drop.
Yes! As someone who used to play field hockey it used to confuse the hell out of me too haha
@@SimonClark Hey Simon, thanks for sharing. I hope you can please respond 🙏to my other comment when you can. It would mean a lot. Thanks very much.
"Going through recent papers in atmospheric science and translating them for a popular audience" = science communication!! I love it, as I encounter more and more climate journalists and science communicators, I want to know more about how I can potentially be one-- so please DO keep making these videos, I love them!
Yes please keep pushing lies that reinforce the mainstream fraud about unscientific man made climate change when the Earth is not even getting warmer pretending to analyze the data but having just the father of the fraud Mann himself as your source. Just like using a convicted serial killer's opinion as ultimate evidence about his innocence. Summarizing: "I was wrong and altered the data, manipulated the equations but in the end I was right by magic, let's save the Earth, folks." You clearly know science as well as the guy in the video.
You can't unless you want to lie to the world for a living
You may want to watch the youtube video "Six ways to make your science sticky" by John Cook. The video is modeled after the book Making It Stick.
I hate RUclips hard youtube's anti spam to makes it for me to tell people about other websites.
edX has free self-paced classes (MOOCs) on things, including on MOOCs on climate. edX also has a class titled "Science Communication". One class they've I've watched a lot of (Making Sense of Climate Science Denial) is geared specifically to debunking climate myths.
@@HiddenHandMedia I can. It pays well. You get loads of travel curtesy of the tax payers. It makes it easier to get stuff published. You can make up any rubbish and still sell it. You can just explain everything by blaming emissions, like some 15th century charlatan blaming it all on witches. You can commit crime in plain view yet claim you are some kind of hero acting in the public good. Plenty of reasons why the lazy, weak and corrupt join the climate franchise.
Got a problem with the tree ring core: depending on where you get the core you could get different ring thickness and spacing, just by looking at that one photo. Trees aren’t perfectly circular and some rings on the photo are right against each other on one side of the tree but on the other side those same rings are farther apart.
You need a lot of trees and sections from different directions and you need to establish how stable the water supply was. Worries about tree data is one reason there have been so many other proxies studied such as trapped gasses in ice and pollen distributions. The trapped gasses data is good because it samples the atmosphere itself which averages over the globe. On shorter scales
In addition to what you said about tree ring widths, there are other factors that affect the width of a tree ring than just temperature. A wet year gives wider rings. If the weather was unusually cloudy in a year, you will get narrower rings. Neither of these are accounted for in their proxy series.
@@e-curb with a large enough sample and careful selection they can be, for example tree rings at higher elevation respond to temperature more than rainfall
@@Benthorpy "careful selection", meaning they leave out the data that doesn't support their pre-determined conclusions. This was documented in the Yamal series. Data from trees that lived 1000 years ago that didn't show the warming they were looking for, was simply left out.
@@Benthorpy But then you are modeling less than 10% of the earth instead of the earth.
Tree ring thickness is predominately relative to moisture (rainfall), and has little to do with temperature.
Perhaps, no idea but they don't only rely only on tree rings but on many other proxies.
@@jean-pierredevent970 if they misinterpreted that variable so obviously, what makes you think they did not do it with all other variables?
I am not qualified to answer this but if another proxy shows high temperatures and trees grew fast than it must have been a favorable temperature condition with enough moisture too. Suddenly with Covid, nobody trusts science anymore but medicine was always a bit a art and a science together. For many diseases we don't know exactly the cause. Some medicines work but we don't know why exactly. Etc. In climatology, there are many questions where the answer is not yet fully clear. But at the same time, this field seems to have the most humble and honest people. Not a single climatologist is a "star". Most people will not be able to give a name. They show the error bars. They show their evidence. They are often a bit shy and nerdy and find it hard "to sell" their knowledge. (ex.: Jennifer Francis )In an interview with a skeptic however, they give very eloquently their "arguments" but rarely some evidence which can be checked. They rarely have done good discoveries themselves, they just criticize. So what they say seems not so different from their opinion, their gut feeling to me. " it will all be fine" OK, do they have a crystal ball? No, so we better be careful. If the skeptics are so sure of themselves they can promise to pay if something happens. We don't hear such promises however.@@SickPrid3
Warm temps may actually stunt some plant growth, if the temps get too high. Also c02 levels also would make plants grow much faster. Didn't they also add in some data at the end to inflate the modern temp delta. Not sure, but think it was sea surface temps they added. All in all the old chart was almost worthless, I don't think humans can out perform an ice age so id be willing to take a chance on a bit of extra heating if it got us a few more years out of an ice age.
@@jean-pierredevent970 These days the public is more awake of who funds "the science" and that includes covid, paid in large by big pharma and philanthrocapitals like Bill Gates. "Who pays the piper calls the tune", in their research is tainted by having a predetermined result or they lose their grant funding. Even the most humble of climate scientist has to put food on the table, put a roof over their heads and put their children through college and university, has aspirations to climb the greasy pole. Going against the narrative paid for funding from UN Agenda 2030 sustainable development goals, Federal government and Climateworks Foundation etc etc can be detrimental to the wellbeing of their careers.
Apologies if you have a video on this: Since most of the modern temp data is coming from cities, and cities are warmer then the countryside and they get warmer as they grow and industrialize, why should the tip of the stick be considered accurate when most of the data is very inaccurate, especially when you consider the US built around 1500 temp stations in the countryside about 17 years ago, and over the 17 years they have observed no warming, while the IPCC says the US has warmed significantly?
could you show a reference for this? I think nearly everyone is aware of "heat islands".
interview with anthony watts is a start. ruclips.net/video/UmIJCGQzCiU/видео.html
The only charts that show no warming are the ones that don't adjust for methodology. The NOAA publishes adjusted data with transparent reasoning that shows very similar temperature changes. And it is worth noting that a single region not experiencing significant warmth over a 20 year period wouldn't be out of the ordinary, it would be contrary to expectations if it was global or if it lasted much longer which it doesn't. Even the raw data shows significant warmth on a trend line over the past century if you zoom out on those 17-year charts.
@@waynepatterson5843 Wayne Patterson is an imaginary person and as such all arguments made by them can be discounted as not real. Wow it's very easy to win arguments this way, thanks for the demonstration :)
A single paper, especially one using very sophisticated modeling, should always be taken with a grain of salt. There's a large potential for error of all sorts creeping in. The overall conclusion is supported by a very robust body of research, but I wouldn't be that confident about the specific details, especially regarding the deep past.
Totally correct. Reinforced by this paper showing the error propagation over time is so enormous as to make these projections meaningless.
Reliability of general circulation climate model (GCM) global air temperature projections is evaluated for the first time, by way of propagation of model calibration error. An extensive series of demonstrations show that GCM air temperature projections are just linear extrapolations of fractional greenhouse gas (GHG) forcing. Linear projections are subject to linear propagation of error. A directly relevant GCM calibration metric is the annual average ±12.1% error in global annual average cloud fraction produced within CMIP5 climate models. This error is strongly pair-wise correlated across models, implying a source in deficient theory.
The resulting long-wave cloud forcing (LWCF) error introduces an annual average ±4 Wm-2 uncertainty into the“The simulated tropospheric thermal energy flux. This annual ±4 Wm-2 simulation uncertainty is ±114 × larger than the annual average ∼0.035 Wm-2 change in tropospheric thermal energy flux produced by increasing GHG forcing since 1979. Tropospheric thermal energy flux is the determinant of global air temperature. Uncertainty in simulated tropospheric thermal energy flux imposes uncertainty on projected air temperature.
Propagation of LWCF thermal energy flux error through the historically relevant 1988 projections of GISS Model II scenarios A, B, and C, the IPCC SRES scenarios CCC, B1, A1B, and A2, and the RCP scenarios of the 2013 IPCC Fifth Assessment Report, uncovers a ±15 C uncertainty in air temperature at the end of a centennial-scale projection. Analogously large but previously unrecognized uncertainties must therefore exist in all the past and present air temperature projections and hindcasts of even advanced climate models.
The unavoidable conclusion is that an anthropogenic air temperature signal cannot have been, nor presently can be, evidenced in climate observables.”
www.frontiersin.org/articles/10.3389/feart.2019.00223/full#B97
And I don’t hear any factors for volcanic activity and cloud cover (since CO2 is a minuscule component compared to atmospheric water vapour) entered here. Which means the assumption that anthropomorphic climate change is the sole driving force for temperature change is probably Hawthorne Effect.
@@cestmoi7368 The water vapor component is a big deal. The problem with higher temperatures is that that will increase the vapor levels too, then clouds go up and don't come down. Obviously this isn't an overnight event but it would turn earth into a planet much like Venus over time.
My concern is that (western) governments have chosen the alarmist view of an extremely complicated and inconclusive body of work, then say "the science is settled" and go about scaring school kids and gullible adult voters.
The only thing that's settled, now that we've swallowed the big green deal, is a lot of people are going to get very cold and hungry in coming years.
@@paulwooton4390 So much money. So little results.
The science used to be settled that the earth was flat.
The science used to be settled that scurvy was could not be helped by citrus fruit, but exercise and laxitives.
Alarmist scam.
I find it extremely odd that humanity gets time and time again schooled by nature and we still believe it all revolves around us.
Exactly, it is laughably arrogant when people claim to that humanity could possibly destroy the planet over the course of a few centuries, the same planet that has existed for untold millenia. Or that the Earth needs people to "save" it. For the entire history of humanity up till now, humans have been living at the mercy of the whims of nature, the sun and stars, and I don't expect it to be different for the foreseeable future.
The truth is that if we are to take climate change seriously and truly want to not make harm (as some may claim the Industrial Age has caused)
we must recognize the alarming similarities to said human damage that all ready happened, we all need to encourage different opinions even those who we vehemently disagree with and a free respecting debate, we need to put emphasis on not turning this into a political show and most certainly eliminate any possibility that greed might somehow destroy different or efficient ways to produce clean energy, we need to empower normal people to make good decisions for the environment not demand they do or lecture them to do so, we also need to stop fear and hatred revolving this issue no good will come from young man and woman deciding to not procreate based in part large or small of climate change, the list goes so far climate change is proving to be a business before anything wether it is fueled by opportunism or power, guilt or fear it matters not, my ancestors have been planting trees way before science deemed it necessary or beneficial.
@@anoxthefighter7933 agree💯. I'm afraid my first reply was poorly worded. I'll reword it to avoid confusion
@@superbarnie I see, it seems I went overboard, for that I ask forgiveness if I made you uncomfortable.
I also need to confess to that I used to be a person that believe in all that you have said in your comment, I still do believe in recycling but it has changed drastically as today I recognize a lot of the flaws humans bring to the table when it comes to this discussion, so I just want you to know that my oversized comment came from a place of respect and wanting to discuss with people who still blindly follow the craze climate change has become.
@@superbarnie the people who claim that climate change will destroy the world are not helpful at all. the biggest victim of climate change will be ourselves, and our civilisation. we can't shift the entire earth from it's orbit by an inch, but we don't need to that in order to melt the poles and flood our cities. even in the worst case scenario, "life finds a way". but we can destroy most of the life we have today, and we won't live long enough to see what happens afterwards. and we are not 'at the mercy of the whims of nature'. If you are cold, you turn up the heater, if you are hungry you go buy food. we have split atoms and communicate at the speed of light. pretending we're just sitting here waiting to see the cards nature has dealt us is just ridiculous.
I am always interested in the crazy amount of ice that covered the northern hemisphere just 10 thousand years ago. When they say that New York was covered with 500 feet of ice, I see the amount of global cooling that got the planet in that position and the amount of warming that got it out had to be considerably more than we talk about with the hockey stick climate change.
You should check out what happened during The Great Oxidation Event, which is probably the greatest mass extinction event the Earth has ever seen - almost spelled the end of life actually. It shows what happens when the correct amount of greenhouse gases do not exist. i.e. too much or too little has a detrimental effect on the Earth's environment.
Where I live we can see the remnants of the last ice retreat about 10,000 years ago...no fossil fuels or cows back then!
@@tomgreene1843 I don't remember anyone saying that CO2 is the ONLY cause of warming. There is a natural 100K year cycle, of cold and warm, the last one peaked about 20K years ago, and was 4C below today's temperature. The scary part is we're well ahead of the expected warming curve. So on the bright side, we won't have to worry about another ice age in 80K years, which is a good silver lining. But at this rate we'll be too worried about food, and starving in 25-50 years.
@@tomgreene1843 ruclips.net/video/dpvd9FensT8/видео.html
CO2 is plant food. NASA reports the greening of the earth by increase 18% since 1980. Well be able to grow lots.
I wish this graph and paper didn't get so much attention when someone like Charles David Keeling's research at Mauna Loa was arguably the most important for our understanding of climate change, yet it gets very little recognition in the public eye.
Ofcourse there are many better contributers, but you can see from this how climate deniers drive the public debate wheter or not they have science behind them
@@fable4315 You can see it from the fact that this very video, which is well researched and on the CORRECT side, got that misinformation banner.
@@monad_tcp I cant see any misinformation banner on this video? has it been removed, or is this a regional thing?
@@MrAntice I don't see any either, it likely gets slapped onto videos by some algorithm that can pick up climate things are being discussed but is probably not reliably capable of determining if it's a video with accurate information or just plain misleading.
So maybe it was reviewed manually by a human later and the warning label removed? Or maybe youtube/google by now have some kind of more processing power intensive second system that reviews videos if requested before it gets seen by a human, honestly don't know how their vague systems work. But I have noticed that some videos will typically get warning things slapped on it early on and they disappear over time when they probably shouldn't be there.
@@extrastuff9463 Analysis software is computationally expensive, and AI's that use trained detectors are even more so, So maybe it's a case of them only using their AI on videos reported as controversal/has certain keywords in their title/descriptions.
I looked into the price for an image processing AI that uses trained detectors for analysing orthophotographic images. (used for counting trees, animals, detecting cracks in pavement over large areas etc).
The prices are pretty darn stiff to say the least, and I cant imagine video with sound being any cheaper computationally than 8 bit orthophotos even if the photos are in the GB range size wise. (orthophotos do not contain compression btw. since that would cause a loss of critical data for the detector algorithms to work with).
I have lived 100 yards from the quay of a small coastal town for 35 years. During this time, apart from minor flooding at high tide on spring tides when there is a storm or strong onshore wind and which goes down when the tide goes out, I have noticed no rising sea levels.
Cool, I'm sure everyone here is genuinely pleased for you.
Now would you please tour the Pacific islands & tell them their graveyards aren't under water? Explain to the people of Wales why coastal villages have been abandoned & the villagers moved inland? Explain to the taxpayers of London why the Thames Barrier was built & why it has been used? Explain to the people of Bangladesh what's happening to their country?
I too live on a geologically static tectonic plate and have noticed from photographs more than 130 years old, that indeed, there is no appreciable difference in the level of the Pacific Ocean. However I’m sure the other commenter to you has accounted for tectonics because of course we know the oceans aren’t continuous.
Same. No rising here so far.
I lived in Honolulu for 20 years and the sea level has risen enough to make Kaka'ako inundation a regular event, when it used to be just during spring tides.
The average rate is only 1.4 mm/ year over the past 100 years, but when you live on the edge a small change is a big change.
@@nmarbletoe8210 Definitely geologically stable and not in a subduction zone at all...no active volcanoes to be seen I’m sure...
I have always wondered how temperature estimates for years long gone were done, thank you for explaining that.
Scientists be clever!
Yea, it's as simple as: Ask the monkeys!
The alarmists never get tired to find new silly ways to explain their lies.
They use the ratio of two Oxygen isotopes O18/O16 and compare the oxygen in CaCO3 (sea shells etc) with that of glaciers and land Gastropoda.
@@oldineamiller9007 all edge and no point
It seems to me a waste of time if it 7 years to make some estimates? They could have asked University of Copenhagen: ruclips.net/video/WE0zHZPQJzA/видео.html
So, the guy who created the hockey stick was asked to supply the data for his study, he said it wasn’t finished. Asked again later the data was vanished. So basically the hockey stick can’t be verified.
When did he say that the data vanished?
The original "hockey stick" is irrelevant now, as it has been independently corroborated so many times by other teams using better statistical methods, more evidence, and higher resolution. They did it better than Bradley, Mann, and Hughes, in an attempt to bust them, and corroborated the findings instead over and over between 1998 and today. That's why MBH1998 is superseded. It wouldn't even matter if Mann done the things the oil industry shills accuse him of, since the corroborators don't rely on his work.
The hockey stick shape of the Holocene temperature record is one of the most thoroughly corroborated findings in science.
@@rps1689
Provide a link to the corroborated studies.
@@LSuschena I keep posting them, but they get removed. It gets removed even if I just put in the titles so you can do a search.
@@LSuschena They are being removed so if you are still interested, I can put them on another youtube video called Measuring the Human Impact on Climate Change The Hockey Stick Graph.
Now we understand it really well. Not before like when they understood it really well. This is totally different. I mean really well this time.
We're super duper serial now
Please ignore literally every prediction we said was scientifically proven to come true but didn’t, we know for sure this time!
P.S. Please give us all of the money. Thanks.
That is why I beg people to read "An Inconvenient Truth". Notice the publish date before. Notice all those "in 10 years this" or "in 20 years that" have come on gone. Nothing has come true...
@@barrythehatchet1380 Pretty inconvenient, that. For the Author, I mean.
I would like to request clarification on one point in this climate change discussion. I have heard (please correct me if I am wrong) that of all CO2 emitted into the atmosphere each year, 95% of it is from natural causes. If that is so, and only 5% of CO2 emissions is from ALL human activity, and America's contribution is only a piece of that, how is forcing everyone to drive electric cars going to change these numbers, especially in view of the facts that China is frantically building more coal-powered electrical generation and all electric vehicles are, essentially, coal powered anyway?
Simple clarification: nature not only emits CO2, it also takes up CO2. Right now, nature is taking up more CO2 than it emits. So, while our human emissions may be 'only' 5% of what nature emits, nature takes up more than it emits, meaning that our emissions are 100% responsible for the increase.
That is a good question. Here's another one. Somewhere in these videos is a clarification of ice cores showing an increase in CO2, but it takes place after the warming. I wish I could find that video. It makes sense if you think about it. Warming would cause the growing season to last longer so plants would be converting CO2 to O2. Drop in CO2. Then planets die as temperatures drop and CO2 goes up. Don't take this as any type of proof, at most it's junk science because climate isn't my area of study.
@@francisdhomer5910 You're actually not that far off - in the past warming *in some parts of the world* started before CO2 increases. This is related to the so-called Milankovitch cycles, where solar energy is distributed differently over the earth depending on a set of orbital parameters (the earth itself wobbles, and so does the sun-earth distance). Here's a pretty good video that explains this (there are many more, some with more details)
ruclips.net/video/iA788usYNWA/видео.html&ab_channel=It%27sJustAstronomical%21
The CO2 is mostly a feedback to the warming, thereby further enhancing the warming. Note that in the Northern Hemisphere the warming may *follow* the CO2 increase, whereas in the Southern Hemisphere it is the opposite, and that there are parts of the earth's history where greenhouse gas increases (not just CO2) likely triggered the warming (e.g., the so-called PETM).
Humans contribute 3.8% CO2 not 5%.
Notice that in the 2 years after the start of COVID19, there was no noticeable dip in CO2.
Cars only contribute 1% of CO2 on earth. Therefore, the political class is hoaxing us.
@@Marco-it2mr Wrong. CO2 follows ocean warming in BOTH HEMISPHERES. However, they simply alternate according to the available season.
(Subsequently, Marco proved this wrong)
Think you could have mentioned professor Keith Briffa's treering temperature reconstruction which didn't switch data sets, to weather station temperature records (Orchard fields airport/O'hare) Mann's "data" didn't do to will in the 2019 US supreme court case's 18-1451 & 18-1477 either.
When the raw data Briffa used was found and analyzed independently, some trees showed the temperature trend they were looking for, while other didn't. Instead of trying to figure out why, he just ignored the data that didn't support his predetermined conclusion.
Few question to consider:
1) Why proxy data is used only for the past, but not for the present? Why can't we use the same methods to "measure" the current global temperature?
2) Why is data of present global temperature is gathered from cities and airports? These places are typically way warmer than their surroundings?
3) Life was thriving under warm temperatures. Most of global extinctions happened during ice ages. Why should we be worried about climate becoming better?
Gotta say... some good questions!
@@FergusScotchman You like questioning stuff? That means you are scientist denier. People of science never question anything - they believe the dogma and follow what politicians and journalists tell them to follow.
Stop questioning stuff, of else you will become climate denying MAGA conspiracy antivaxxer of putin's troll farm.
@@evgeniiferdiuk9535 It's insanity
You have to wait 30 to 50 years for ice cores so that the ice forms and stabilizes.
CO2 increase modifiés the growth of trees.
Extinction during ice ages ? Check again.
@@philippesarrazin2752
Tree rings can be checked within 2-3 years.
Yes, CO2 is the most important natural gas on this planet.
Yes, every ice age caused at least some species to go extinct, while over half of great extinctions were caused by ice ages.
It's always amazing how many contortions people will go through to "prove" their pre-conceived ideas.
I quite agree
@@pauljackson2409 r/whoosh
@@Mesjach
Science is about trying to disprove your models, so i guess the /whoosh can be attributed to you as well? There's a large number of inconsistances with almost every single climate model presented, and that is most likely because refusal to implement data that may be conflicting your model.
Imagine that? Some scientists have to big of an ego to let go of their pre-concieved ideas? Almost like they're also human.
There's a whole slew of questions i've had for scientists within the field, which they've never been able to answer. They seem to ignore these in their models. If it is intentional, or just that they don't think it can be of any significance, that's something only they can answer. However, if it's that it's not significant enough to use in a model, then it would be a simple answer. Would it not? These questions range from things like oceanic water pushing into the mantle, to quesioning how climate friendly solar/wind really is considering the need to mine the components (with increased energy demands globally). I'm not questioning climate, i'm questioning the models, and missing data.
Can you please elaborate on the heatwaves of 1901 and the 1930’s?
They are irrelevant; they were regional.
@@rps1689 no they were not regional
@@ddoumeche Yes they were regional; not globally synchronous.
@@rps1689if facts don’t match with your believes, than it’s just an incident…..
Aliens
the hockey stick graph was declared fraud by a Canadian court after the creators refused to let it be peer reviewed.
That's an over simplification that misrepresents what happened.
Stop repeating bollox, care to substantiate that ridiculous statement you obviously copied from lies spread over the internet. Are you capable of free thinking?
@@lrvogt1257 you mean like how the climate alarmists alter data and oversimplify things they can't predict nor control?
@@SoloRenegade : How is it that deniers who pretend to care never pay attention to the facts? Or do you know it's false and don't care? Hiding data didn't happen. It was a baseless accusation that was thoroughly investigated by a dozen official and media entities and found to be false. It was a slander by fossil fuel shills based on taking a few phrases completely out of context and misrepresenting them.
There is nothing simple about climate science except the primary factor that more CO2 traps more heat. If you know how much CO2 were adding you can predict ow much warmer it will be. Today's temperature was accurately predicted in the 1970s. There is a record of global temperatures that show a very steady trend. Industry is changing the climate but not in a controlled way. We can only hope to mitigate the damage by reducing industrial emissions rapidly.
@@lrvogt1257 CO2 has a logarithmic affect on temp, even the climate crazies don't deny that because it's scientific fact and has been proven countless times throughout history. That means to get to even 3C of global warming we'd have to get to 1600ppm of CO2, and 3C global rise is nothing.
NASA/NOAA alter the temp record and refuse to share how and why they are altering the record so that others can try to replicate it (peer review). It was factually warmer in WW2 than it is today. and even as CO2 rose massively after WW2, temps plummeted for decades. And during the roman era it was up to 10C warmer than it is now.
Mann factually lost the court case in Canada for refusing to subject his work to peer review. Therefore he was ruled a fraud in court when all he had to do was open his research to the world (if it's not available for peer review, it's not science).
Who would have guessed that over-fitting data to the model you want would take 7 years??!!!
Indeed. It is hard to make all the data fit a premise.
But surprise surprise THEY DID IT!
@@owenabrey1433 I suppose there is some local minima that fits the data and if you try for 7 years, you can probably find it.
😆
What a great price, I'm definitely gonna sign up. Keep up the hard work brother
Modeling has never gotten anything wrong, ever.
Not true. check out "J. S. Sawyer (1 September 1972) Man-Made CO2 and the Greenhouse Effect".
@@milankovitch8697 not familiar with sarcasm, eh?
So what caused the Medieval Warming period...that you acknowledge was real...unlike Mann who cut it out from his hockey stick graph
Question: I might have missed it in Clark’s video, but since the proxy data seems to be of prime importance, to what extent in time does this data exist? Is every set of proxy data valid over the same time period? If not, then what happened is that the hockey stick was assembled by merely stitching smaller data sets together to create data over a longer time extent. I suspect that is not a valid way of creating anything meaningful. Now, if each proxy dataset extended over the same time period, and they all had the same character (peaks and valleys in the same locations), I could see that this might be meaningful. Otherwise, stitching together proxies is invalid, IMHO.
But what Mann did was switch to a modern technology for the last 2 decades because the tree rings were not showing the warming he NEEDED to show. That is what started the big IPCC hockey stick scandal & the walk out of lead IPCC scientists. The creation of pseudoscience was born.
Mine as well
ruclips.net/video/CqtZdnpfgIc/видео.html
AFAIK that's how proxy data sets are generally callibrated. E.g. start out with thermometer measurements and compare them to tree rings and lake varves, then compare those to chemical markers in ice, and so on. That's the major reason you get less precision the further back you go.
IIRC the "trick" that got denialists so exited during "climategate" was a mathematical equation that lined up a set of tree ring data with other known proxies (there were other, known, factors that influenced the tree ring data, but figuring out the relationship was difficult).
@@henrikgiese6316 Hi Henrik. That is precisely my point. Not knowing all the different factors that affect tree ring data, the ability to accurately “stitch” them together relies on your confidence that you have completely eliminated all other factors except CO2. By not making public his method for doing so speaks volumes about his credibility as a scientist. IMHO his hockey stick graph should be regarded as invalid, and all future pronouncements by him should be discounted by the fact that he does not the follow scientific method.
Great video doctor Clark!
Thank you kindly!
Now do one where you go back millions of years to the Jurassic and other periods when CO2 levels where 4-8x today’s levels and the Earth was a biological paradise.
LOL - right
Grow up. At those times there were no humans. No mammalls, and none of the species we depend upon.
There *were* carnivorous insects a foot long.
The relevant period for *us* is the period over which we and the species we depend upon evolved.
CO2 has not exceeded 300ppm in over three million years. *that* is the scale to consider.
I've grown weary of wealthy policymakers telling me how I should live while they'll likely continue enjoying steaks, air conditioning, and all of the other amenities I of modern society. I have no problem with using a combination of renewables and nuclear. I certainly don't think that renewables alone are ready to be our only source unless make a real effort to decentralize how we generate our energy. I just refuse to go along with any scheme that doesn't involve an effective solution to the energy-production end of the equation.
Then there are many who carry the misunderstanding that having an EV will automatically result in fewer greenhouse emissions. Maybe if you are using the most efficient power transmission lines and the fewest amount transformers and substations to the tap, then yeah.. it might be more efficient even if that energy is generated by natural gas. At least that what I've been told. Seen one meta study which tried to make this point but it got lost in the noise. Is it really more efficient to generate electricity with natural gas and send it to an EV or is it more efficient to just burn the fuel in the ICE to make immediate use of it for locomotion?
One argument I've heard is that the fossil fuel industry receives tons of subsidies. Well, if that is the case.. which ones? I'm all for nixing those subsidies as a step towards leveling the playing field.
Very good points! It seems unlikely we can generate enough electricity from wind and sun, and hydroelectricity is very limited unless you live in a really mountainous country. Nuclear, aside from being historically much safer than it is given credit for, can generate a lot of power.
In terms of EVs, the overall efficiency of generation and distribution cannot be made much better than the efficiency of ICEs though petrol and diesel contain a higher proportion of carbon than natural gas.
One thing that concerns me is reliability of supply. At present if there is a power cut for a few days, we can use gas fires and the like. If we only have electricity we will be d****d cold!
They should remove all subsidies from power generation companies including the so called green ones. See who comes out more cost effective then! Survival of the fittest
Are you going to update this in light of recent revelations (October/November 2022) about how climate models have been significantly overinflated?
I don't get your point. Your final] graph shows warming of about 1.2°C over the last 150 years, which is not in dispute. However your claim about the Medieval Warm Period is very much in dispute. Signs of it have been found in the southern hemisphere even Antarctica, where it appears to have been less marked than in the northern hemisphere but still present. There are also many other studies which have found good reason to question how much greenhouse gases have contributed to temperature rise. The GMT during the Holocene optimum is also in question and may have been between 2 and 3°C warmer than today, which if true means today's GMT is not unprecedented. It all amounts to which proxies you want to trust and which to discard. Remember, science is never settled, and if you claim it is, that is not science.
"However your claim about the Medieval Warm Period is very much in dispute. Signs of it have been found in the southern hemisphere even Antarctica, where it appears to have been less marked than in the northern hemisphere but still present. " But it's not synchronous the warming happens at different times at different spots on the earth--there is no other globally synchronous warming like what we have created.
Apparently, the algorithm used would have given a “hockey stick” upturn on any data set.
That's what my math gooroos said as soon as they got ahold of it . . . FINALLY got ahold of it that is.
Hi Simon, this new paper mentioned the tilt of the earth. I've watched loads of videos about the milankovich cycles, so, while i understand in general how it works, I've seen nothing tying any of them to a time period. So, i can't figure out where we are right now. Could you take this as a request for a video topic?
The last four glacial periods were 105 thousand years apart; synchronized to the Milankovitch cycles all.triggered by slowly changing greenhouse gas concentrations. The Milankovitch cycles are in a cooling phase now, as they have been for hundreds of years and will be for hundreds of years to come; those orbital eccentricities apply a cooling force yet are not driving the warming.
This channel has another video explaining how solar warming gives a different result. The stratospheric temperature changes differently if solar radiation is the cause. It clearly demonstrates that what we see now is caused by the increasing greenhouse gas4
@@DazzaOnGoogle I believe that climate change is real, anthropogenic, and a threat to humans. I want to see dates, numbers, measurements, and projections because i'm curious, but also to win arguments :p
@@manjuh4236 Win arguments? You might win them but they won't be recognized by the majority of the deniers out there. You'll write a paragraph or two with whatever dates and measurements you want but they'll just respond with "LOL nice try SHILL. Just shows how indoctrinated the libTARDS r". But someone's gotta speak the truth I guess, so I admire your compassion to seek and spread the truth.
@@DazzaOnGoogle Keep in mind nobody has successfully described a mechanism for variations in the solar wind to significantly influence climate especially during industrial times.
Look up “Solar Cycle: and “Introduction to Solar Radiation”. Also look up “Ask NASA Climate - Flip Flop: Why Variations in Earth's Magnetic Field Aren't Causing Today's Climate Change”. Good source for laymen, but other sources are available. As for papers, there isn’t much out there about the lack of correlation between completely unrelated things like solar flares and climate change, as the effects from solar flares last for less than a day and are one time events. Climate change requires a forcing, and for an event that lasts less than a day to cause climate change, one humungous forcing like a giant meteor strike or a volcanic eruption bigger than any in human history would be required.
Note that on scales from minutes to hundreds of thousands of years, total solar irradiance is practically constant; that its tiny variation on an eleven year period (one part in a thousand from the mean) correlates with no climate or weather trend; only short term changes in the atmosphere.
"The value of the constant is approximately 1.366 kilowatts per square metre. The “constant” is fairly constant, increasing by only 0.2 percent at the peak of each 11-year solar cycle. Sunspots block out the light and reduce the emission by a few tenths of a percent, but bright spots, called plages, that are associated with solar activity are more extensive and longer lived, so their brightness compensates for the darkness of the sunspots".
The most accurate statement in this video is the fact that our scientific knowledge is always expanding. Unfortunately, many people, including scientists, are very resistant to new ideas that challenge widely accepted views. Just as the hockey stick graph has adjusted and fine tuned, other discoveries have been made. We have learned that climate is a very complex subject. We constantly discover new variables that have an effect on climate. You can never say that any theory is carved in stone. A true scientists knows that the more we learn about something, the more we realize what we don’t know, which is usually far more than we do know. Question everything!
Valentina zarkhovas work is quite compelling and it pretty much states in a nutshell that climate is mainly effected by the sun! Not us. Science tells us most of the time what is not, not what is.
We've known that carbon dioxide was a greenhouse gas and that increasing amounts are warming the planet since the 1950s.
That is data not theory.
All subsequent data has confirmed over and over.
Saying scientists aren't interested in new information is completely ridiculous
Actually, the down slope of the original hockey stick may still be valid for the northern hemisphere ?
The 2 hemispheres do not have the same temperature evolution profile, do they ?
NO, the downslope of the hockey stick was within the time period where we have THERMOMETER records and these showed an INCREASE in temperature, thats why they HID the downslope.
@@peterjones4180 Come on ! 2000 years of downslope !
Actually even Andy May, a guy who publises regularly in WUWT posts regional reconstructions and if you do some research you will that the NH temperature furiously looks like a hockey stick.
@@philippesarrazin2752 You may be referring to a DIFFERENT downslope, I was referring to the temperature downslope that Mann deliberately hid behind another graph line
so that others would not realize his data was NOT fit for purpose.
Insofar as the earth has a 120,000 year cycle that is very clear in the Vostok and other ice cores, yeah, the basic trend applies to the whole earth.
Very interesting. The upshot is that the present episode of man-made global warming is EVEN MORE DIRE than originally thought.
The graph at 7:10 implies +/-0.5 degrees error in the proxy calculations by its width. However proxies are calibrated against each other by their originating researchers, coral to pollen to tree rings, and the ones that don’t match are thrown out as invalid. So the shaded red zone could easily be twice as wide and include significant up and down swings. As far as the last 100 years nobody is arguing that temperatures haven’t gone up about a degree. Instead of panicking about this one degree, maybe a more valid point is that the preceeding 7 degree rise seems to have been beneficial to mankind, and detrimental to wooly mammoths.
That's an argument that is never made. I'll point out one more thing that everybody overlooks. There was more warming in the first third of the 20th century when man made co2 was much lower than there was in the last third when mm co2 was multiples of the earlier period. ( it didn't warm at all between 1944 and 1980 . whoops)
@@notacommie7154 kinda like all that CO2 we've made in the last 20 years and all that warming that didn't happen. (Well, unless you listen to those studies that magically found after the fact that the "pause" never happened.)
@@beetle3088 that's because there is zero correlation between co2 and planetary temps. An example of telling a huge lie, repeating it and relying on the scientific illiteracy of the public to create the consensus. Disgusting.
medieval warm period, a 'regional' event recorded in tree rings across the planet.
300 years of excessive warming is just dismissed as 'regional'
we have 3 weeks of days in the winter of 30 degrees below normal. that is 'weather'
we have one day of 105 degrees and that means it is man caused global warming.
Tree ring width is more related to moisture than temperature. So wider rings may mean more rain not higher temps. In fact higher temps could result in thinner rings.
Not exactly. There are several causes for tree rings to widen; moisture and temperature. In dry climates the rings are mostly affected by moisture but in temperate climates (most of the north and southern hemispheres) they are affected by temperature mostly.
As you said Mann relied quite a bit on tree rings to determine temperature...In today's world, where we can measure temperature to a tenth of one degree how accurate are tree rings?
Questionably accurate, at best. The problem is that whilst it is not unreasonable to treat tree growth as a proxy for warmth, tree growth is also affected by many, many other factors, none of which can be separated out. Really, all proxy data for warmth have some deficiencies (or else we'd be able to get accurate, uncontroversial estimates of global temperature for as far back as we'd like), and climate "scientists" have done a great deal of damage to the credibility of their claims by indulging in some pretty shady practices in how they manipulate their data, and more so by how they present their findings.
Now, that said, I also find it inconceivable that human activity has had NO impact on the global climate. Is it to the degree that some claims have stated? Probably not, it turns out. Is it far more than is good for us? Probably yes, and this new (and apparently much more rigorous and credible) paper may well be a good place for climate scientists to start making that case properly. I would also add that regardless of all of climate science, it is an absolute fact that the world needs to stop using fossil fuels (or at least greatly decrease their usage, and limit them to those things where we kinda need them for the moment, and work on finding alternatives so we can completely eliminate them). They are a finite resource that have fairly unpleasant environmental effects even if you totally ignore their potential for causing warming, and getting away from their use would be a really, really excellent idea. Just, let's have that debate on its' actual merits, backed by actual science, and not the bullcrap that the climate science industry has been peddling for far too long
@@talltroll7092 Ok, you sound reasonable to a point...Until you come to what can only be described as the absolutist point of view
" it is an absolute fact that the world needs to stop using fossil fuels " even your bowing to reality with your caveat that followed shows your Myoptic vision that only sees oil and coal...and your willingness to throw the baby out with the bathwater....You have no appreciation for how pervasive Oil and Gas are responsible for the quality of life you enjoy...Your health, your wealth, your freedom from drudgery is all made a reality provided by Energy from Gas and Oil...The Concrete that builds our cities, the Fertilizers that are needed to grow the food on your table the, plastics that replace wood and so much you use comes from Natural Gas...All I ask is that you look before you force us all to jump this green shark
@@talltroll7092 That's a pretty well rounded, and reasonable view on the subject. It falls somewhere between complacency and hysteria which is exactly how we should be approaching this.The only thing I ever see in science and academia is "could", "might", "maybe", etc. They honestly don't know. All I see in politics is "definitely", "will", "inevitable", etc. The experts. The bottom line is that if you follow the science far enough, you'll find the money behind it.
👏👏
@@TheJeffcurran Jeff I agree 100% with what you wrote
Pretty interesting. Not confident much can be done about it, but adaptation is our specialty.
To adapt we actually have to do something and we aren't. Other species don't have the luxury of air conditioning.
It can only fixed by giving the government money! Maybe big pharma has an answer like they did with covid
First step would be to convince China to reduce their pollution... instead the west is spending massive amounts of taxpayer money to reduce pollution (while increasing the cost of living for those taxpayers), while China says the will continue to increase the amount they pollute and western governments say "Sure go ahead!".
@@lrvogt1257 Most people don't have the luxury of aircon. There are regions of the planet that are very warm year-round, and animals seem to thrive in all but the most volatile places, unsurprisingly. Indeed they are remarkably similar to humans in that regard.
@@Generative_Midi_ Indeed. those individuals and species who don’t have the ability to adapt quickly enough will have a difficult time as the tropics become hotter with an increasing number of extreme heat events.
70 years old no visible temp change, living in Sydney australia the whole time. If anything its wetter for longer, so milder temperatures.
There still seem to be some issues with forecasting. Meaning that the further into the future you predict a model, the less accurate it will be. There are several reasons this is the case, for example we can't predict volcanism or in which direction solar events will propagate from or whether we would intersect with them. Politically this is a problem because people on the alarmist side will take the track of the worst possible projections and present them as the most probable. This in turn creates a backlash because the only options on the table are the most disruptive, costly, and radical. This results in deadlock where more modest modifications which could still make a positive impact are not implemented.
Next considering how dense our current data collection methods are, we have yet to establish that the implementation of various "renewables" has made any positive or negative impact at all as positive results fall within the margin of error in the predictive models, and the cultish fervor around discussing the topic prevents consideration of whether one or more may have a net negative impact. This is foolish because if we are wasting resources and time that could be shifted to better solutions, we shoot ourselves in the collective foot.
In regard to the reanalysis, we are looking at a dataset that is very indirect in it's predictive capacity of permanence or runaway. Meaning, while the study uses a multidisciplinary approach, it is still focused on air temperatures, which are easier to gather large sets of data about, but are otherwise a result of changing climate, not a cause. Oceanic conditions are the ultimate arbiter of air temperature, but our knowledge of them is vastly less than of air conditions. We have detailed knowledge of some areas, but we have no idea what contributions to understanding what is actually happening are to be found in unexplored areas. We do know ocean conditions plays orders of magnitude greater of a role in determining terrestrial climate than terrestrial climate plays on oceanic climate. What does that suggest?
Well, terrestrial climate can fluctuate wildly in a short period with minimal impact on the oceans, however, a change originating from the oceans can cause much longer term sustained alteration of terrestrial climates. we don't actually know how quickly greenhouse gases can be removed from the air, or if warming to a threshold could trigger an equally short cooling backlash as CO2 is pulled into the ocean as carbonic acid and polar regions re-glaciate. Again this is because the models don't project well into the future. the "we keep warming till we all die" scenario seems to be as probable as the opposite "we keep warming till the saline ocean currents shift and plunge us into an ice age. There is still a lot of room in the middle of those two scenarios where we could spend more time gathering oceanic climate data and making better predictive models.
Very well said 👏
The most sensical approach to the data that I've heard. I too am suspicious of volcanism, solar events, and the oceans ability to process CO2. The amount of CO2 in the atmosphere is .04%. How much of an effect does it really have at .04%? Trees and plants grow faster (what we need for food BTW) or do we burn to a crisp at .05%??? I'm not on any bandwagon simply because I don't see one that I can jump on.
One can look at major trends in the record and see that as CO2 continues to increase so does temperature. The last record cold year was 1909.
@@lrvogt1257 That's a correlation, which means those things *can* be linked. Correlation is not the same thing as Causation and that's where the rub is for half the population.
1909 being a record cold year does not establish any firm connection to warming as 1902-1908 saw multiple volcanic events with large cumulative ash releases. The impacts of which can vary greatly depending upon where the eruptions occur, the size of particulates, how high they are delivered, the wind currents, seasonal changes at that time and the strength or lack thereof of systems like El nino. The absence of that volcanism or a different geographical layout of eruptions could have otherwise saw 1909 as a normal or mildly cold year. As a result the baseline for the start of warming could be further back. we don't actually know that much about how volcanic activity alters climate and on what timescale. Even today we are surprised by the results of the last major eruption in Iceland.
So here is the common low resolution theory based on correlation:
Humans release CO2, CO2 increases in the atmosphere, it retains more heat than is radiated into space, then temperatures rise, will never stop and we all die.
That is neatly wrapped up and seems rock solid, so that's where we've stopped. The reason why you have such a large amount of people who are either opposed or just apathetic is because when something in science is so neatly wrapped up and straightforward, it's usually wrong.
Previous recent catastrophic models claimed we've already passed a (few) no return point(s) and seal levels would have risen 6-8 feet globally, which didn't happen. The frequency of apocalyptic climate predictions is getting close to the frequency of "the re-re-re-re-revised date of the apocalypse decoded from the bible."
It doesn't help that advocacy of climate science has become dogmatic. Opposition gets criticized for poking holes in the models and theories, but no one stops to ask why there are holes, how many there might be, and how big an effect they could have in their predictions.
If we suppose the correlation is just that and pretend that some new study has uncovered a previously unrecognized process that establishes a direct causal relationship to warming. All of the existing data is still exactly the same. All of the observations are identical. What has to change is the explanation and strategy. That might look something like :
"X is causing a heating effect on the planet. Normally this excess heat would diffuse into the oceans at 10 to 20 times it's current rate, however, because human civilization rose during the end of a glacial melt period when the melt water made increasing land area habitable for a few thousand years, humans were able to spread to those areas.
This was accelerated due to technological advancement before the warming trend dried out the inner continental areas and made them uninhabitable. During this growth period, humans released massive amounts of CO2 which has trapped much of the heat that would have already been absorbed by the oceans into the atmosphere instead. This, in turn, has slowed the effects of the heat increase on the oceans and kept the average salinity at a point where ocean currents haven't collapsed.
As it is unknown how long this current heating action will continue, we are close to the ceiling on CO2 counts that are survivable for land based life, and a massive reduction in CO2 would cause a rapid heating of the oceans resulting in a backlash re-glaciation effect, our best option appears to be researching practical methods of triggering large numbers of small scale volcanic events. This will occur slowly with a few per year, over the next 100-200 years to offset further heating until the main source of thermal increase begins dropping off. "
I'm not saying either theory is correct, but establishing more than a correlative, circumstantial case is required. This is true both intellectually, and in order to proceed in any effective direction, because no effective strategy can be employed with such a large portion of the population unconvinced and apathetic. We are seeing that politically in the US as we speak. The portion of the same population that is largely silent most of the time is a sleeping dragon that no hobbit can wake without severe repercussions.
As i mentioned there are a bunch of things that the opposition takes issue with and the apathetic aren't motivated by. Those need to be addressed sufficiently to either reinforce the current theory or, if they don't, give a clearer picture so a better theory can be established.
We need a much closer examination of world ocean data. Tracking of temperatures current speeds, salinity, etc mapped onto the atmospheric data if it produces a matching correlation, would go most of the way. We need to address the issue of CO2 being the weakest greenhouse gas and understand what happens when petrol is replaced by an increase in water vapor from the increase in Coal or nuclear use with battery charging. What effect the additional water vapor release will have on temperatures, since it has a much greater greenhouse effect per litre than CO2, is a big hole in the petroleum elimination part of the current plans.
@@mrnobody2873 : The actual affect of infrared on CO2, the re-emitting of that energy into the surroundings, the increase of CO2 by half and the fact that it lingers for hundreds of years are not just correlated. Increases in industrial CO2 are causing global warming. It is measurable and predictable and well-understood for a hundred years. CO2 is the temperature regulator, water vapor is the feedback mechanism.
You “forgot” to include a longer period graph. I put together a graph going back hundreds of thousands of years with public ice core data from NOAA and what we are seeing now is very stable in that context. I take the sudden spike to be a function of switching from extrapolated data to observed data with better resolution.
Michael Mann deliberately his the decline & if you take the time to do some research you will realize that what he did was deliberate & means to justify his projected prejudices in favour of global warming.
You're parroting a long debunked slander of Mann. This was a false accusation that was thoroughly investigated and debunked. The terminology was taken out of context and its meaning misrepresented by fossil fuel shills.
@@lrvogt1257 Mann deliberately hid the decline in temperature - why would he do that?
Might I suggest you listen to Dr Patrick Moore podcasts in which he totally destroys Mann's computer projections. In my world especially living in the UK I for one of many would welcome some extended periods of global warming during the Summer season.
@@williammurray3840 : Mann absolutely did not say or do that. The decline had to do with tree rings at certain altitudes diverging from the instrumental record after 1960. It wasn't about temperature but about tree rings. This was investigated by a dozen groups official and the press and found to be a baseless accusation... as I explained earlier.
When questioned about Patrick Moore's book, those he referenced and quoted say he misrepresented their work. He's a shill.
Interesting, seems to be ‘Twitter like’ censorship happening on replies here!
And yet if you watch the video his hockey stick does just the opposite, it doesn't show how far global warming has gone beyond anything Earth has seen since *before the last ice age.*
The graph can be both accurate and misleading. The Y axis shows the average change in temperature with a range of +1 to -1. The same data showing the actual average temperature would show a much less impressive graph of temps ranging from about 13.6 to 13.9. Reducing pollution is a good thing but the drive to instill panic and prompt irrational action is not.
Well said. But it also avoids many dishonest and disgusting facts about the graph and the people compiling it which is now public record. Its a laughable video. The graph was cut out in the 60s or 70s them user proxy data using two sources at the time a 30 plus year cooling period ended so the spike looked increased. The tree rings weren't meant to be used for temperature at all according to those who took them and Mann took out those which showed the opposite so as the average would fit his goal. Then though on a public pay role he refused a FOI and refused to show his methodology to other researchers. When the end of the world is around the corner!
Something that is overlooked is that life, from plants to fungi to mammals, have an easier and more successful time adapting to warmer climate than to cooler climate. In simple terms, it’s easier to dissipate heat through already existing systems, like sweat pores, than to develop new warmth retaining mechanisms, like humans or birds developing blubber layers. Warming isn’t the end. Or rather, it’s mot as certainly the end as a drop in temperature would be. For a real world, real time evidentiary example, compare Texas heatwaves to that cold snap they had. You barely hear about their heatwaves. They’re easy to adapt to, even months long or multi-year lengths. Imagine in contrast if that cold snap they had lasted 18 months.
2C warmer is better than 2C colder. And a sudden and decades lasting 3C-6C drop from a single sizable volcanic eruption could happen in any given year. That eruption is coming. A mild 2C raise now will offset the drop, and will be less catastrophic and more survivable for every creature everywhere.
This forward looking plan is not discussed, as people are focused on immediate effect, and not accounting for unavoidable eventual factors. We can plan for that drop, and maybe cut it in half, there y saving 60-70% of the global population from freezing to death. No one wants to listen to rational minds, and consider the elephant in the room. They’re too caught up in hysterics of rising temps. The real threat is the floor being pulled out from under us, and our unintentional exacerbation of that.
Good post. As for your Texas example the reason you don't hear about their heat waves (In my onion) is it is expected. Right now we are hearing about how cold Fla is. Yet people are not talking about the temperature here in Western NY. That's to be expected.
Is there climate change going on? I honestly don't know. I don't know your age but I'm old enough I was around during the 70's and 80's when we were warned that a new ice age was coming. Then we get warned the planet is heating up, global warming was coming. Then we get told that global warming will trigger an Ice age. Then they change it to climate change so no matter what happens they can say they were right, the climate changed.
The other thing they do is when we have heat waves they say that it's proof of warming. But if we point out the especially cold winter we just had they say that's weather not climate. You can't have it both way.
Is the weather different from when I was a kid. I can say yes. In the 60's and 70's I was playing in the snow at Thanksgiving and we always had a white Christmas. The first day of deer season had snow. Now there are many times when we don't have snow for those times.
The funny thing is they started talking about Warming not long after they had warned of the Ice age. So why am I doubter? It's because of what I have seen over the years. I'm not a denier, it's possible. I'm just doubting what is being brought forward. I know I am a boomer, but I enjoy being called that. Why? He was one of my favorite characters on TOS Battlestar Galactical.
I just noticed autocorrect wonderful of my misspelling of opinion. It changed to onion. I'm leaving it so you can have a laugh. Keep your onions to yourself
All of that is because they are really selling socialusm, not global warming. Kind of like " get the shot to stop the spread" Clear it up?
@@notacommie7154 I can agree with you the people pushing it are doing it for that reason. But I have some left leaning friends(Hell leaning so far left they landed on their face) that believe this stuff because that's what they have been around for so long. And condition to not accept your statement without you giving your source so they can point out why that information is wrong.
And just take a closer look at the numbers. Even at the most extreme error bars, the range of change is less than 2 degrees for the whole of the last 1000 years. And the mean average by less than 0.5 degrees over the same time. To thikn we can change that within a single lifetime is laughable.
Tropical areas will be destroyed with this persistent overheat. Let me guess: you are from Canada right?
I watched this on Nebula, and I just gotta say at 9:20 when you emphasised how we know more about climate change than ever "so can we please fix this" just before ending the video was heartbreaking. Great video! Can we please fix this
Just leave it alone,trying to fix it in the middle of a pandemic when you have enough on your plate is already making people's lives worse ,with 15%inflation,QE,etc,there are no rising oceans,no increase in cyclones ,only unprecedented scare mongering by the media and politicians who are already factoring in a 28 dollars a ton carbon tax,and now we have an energy crisis because we are trying to transition too soon,you can't make this shit up!
One degree Celsius. How much benefit has mankind gained from the burning of fossil fuels, and how much loss has and will it incur from this perversion from what nature presumably would have set our thermostat at? Don't just "do something" without answering these questions. There is a cost benefit analysis required before every wise act taken. Don't just assume that warming is all bad, or that a trend is not naturally regulated by some as yet unrealized feedback loop.
It is also odd that scientists who conclude the opposite opinion do not get financial help.
That's because their claims of "the opposite".
Yes. Nice to find someone with a brain . Money does buy the scientific result.
So it's a lovely hot year but you get no rain, how the hell does that translate as a warm year when there is no growth. If it was a 3 or 4 year drought it might show up as a band but that might also be indicative of a cold period where the tree simply didn't grow. Cell size might be a useful filter but again a wet cooler year will grow as well as a warm dryer year. The measurements taken by Mann were for the northern hemisphere and yet he included data from Tasmania?
This is not science, it's witchcraft.
Dude, Bayesian modeling is so fun ( 6:10 ), I just started using it in my phd work (experimental plasma physics, nuclear fusion) to predict uncertainties from our models, and it literally feels like magic to be given error bars and basically an explanation for the chosen minimum your script pops out. Thank goodness for modern supercomputers cause it takes Forever to run, but so exciting that it's getting used in climate science!
Bayesian modelling looks good on paper, and in an academic environment. In a real world consumer products sales forecasting environment it doesn't work at all. I've spent years trying. I appreciate your enthusiasm, but it's nothing but theory and I have never seen the theory equate to reality in the long term. It works great for short term forecasting. It completely fails at long term forecasting. Climate is long term forecasting. If you want accurate weather forecasting for the next 3 or 4 days, Bayesian models work great. If you want to forecast the weather/climate for the next 80 or so years? Not so much.
I remember a few years back these same people were saying the world was going into a ice age . Did I miss something.
Yes, you missed what the scientists were saying then, what they've said since, and what they're saying now.
In other words, you didn't miss something. You missed everything.
@@mathboy8188 Thanks, NPC.
@@Hornet135 No, thank you. It's always good for chuckle to hear the mindlessly trendy term "NPC". Can you figure out why?
@@mathboy8188 Probably because your software hasn’t been updated yet. The OP is not wrong though, the previous crisis was global cooling.
The biggest lie of the hockey stick is it's short time line.
Thanks- I needed a bit of an update.
Simon, that brilliant 7 year to put together model, with all “The proxy’s”, does it forecast climate? Who commissioned and paid for it? And does it still show a total of 0.8 degrees of warming for the 20th. Century and a slight cooling over the last 30 years?
Is this supposed to be some sort of conspiracy-type gotcha question? Or a legitimate inquiry for this information? You do realize Simon puts every study he references in the description right? Surely if you wanted this for informational purposes you'd have found that but if you still want those answers, by all means, read the studies. They will either impress you or you will ignore their conclusion because it doesn't match with what you want. There is no in between.
@@Chris-io2cs There appears to be a lot in between "impress" and "ignore." It is quite valid to examine any statistical research, as there are dozens of forms of bias possible in any scientific study. Each study should be evaluated based on its assumptions, limitations of scope, and how applicable it is in applying to a larger population. I'm sure you're aware of this.
@@danielmatthews1522 a little off-topic to bring up the scientific process no? I thought it was pretty clear I was observing and pointing out the flaw and questioning his intentions rather than actually proposing that no single person could do anything but agree or disagree with a study.
I'm actually curious why you thought of latching on to something so specific I said like that. It's not an uncommon rhetorical technique usually designed when you see hints of sarcasm to try label the opposition as someone who shouldn't be taken seriously but I can't help but feel you actually think that the only person here acknowledging the reference studies doesn't understand why we need studies rather than just implying it for a slight argumentative gain.
@@Chris-io2cs I would say you came down on him, fine, but then highlighted, a bit condescendingly perhaps, that if he didn't get impressed it meant he must be "ignoring it because it wasn't what he wanted". That was what I was confronting. I just think each study is open to being questioned, evaluated, etc, I'm sure you agree, and that one isn't obligated to take anything at face value. The "because it wasn't what you want" appeared to be an attempt to shame him for questioning the study, perhaps that was not your intention. There is far less actual debate of science going on for environmental topics, and shame and, as you noted, rhetoric, are often substituted.
@@danielmatthews1522 ok fair enough, I'd agree that I wasn't giving him a fair chance and just assuming that he was his intentions were bad. I could still be right about that part, but it's fair to said I took a needlessly condescending approach. I think we both agree that we should continue to research and definitely question that research rather than just take a side.
Cant wait for the next models to see what else we have wrong
Greenland was a lot hotter when the Vikings lived there.
And?
@@hosnimubarak8869 Randon numbers fit better than Mann graph. He erased the little ice too.
@@snowmannor7779
Do some research on what caused the LIA before embarrassing yourself further.
@@hosnimubarak8869 Little Ice Age or Maunder Minimum was a result of a Grand Solar Minimum. Michael Man is a proven liar. He claimed he was given a Noble Prize and even made up a dodgy one for his wall. He didn't receive one.
@@barrybloggs9474
You're an idiot. The Little Ice Age (which was not a true ice age). It was a period of cooling that occurred after an especially massive tropical volcanic eruption in 1257, of the now-extinct Mount Samalas near Mount Rinjani, both in Lombok, Indonesia, followed by three smaller eruptions in 1268, 1275, and 1284. When a volcano erupts, its ash reaches high into the atmosphere and can spread to cover the whole earth. The ash cloud blocks out some of the incoming solar radiation, leading to worldwide cooling. Also emitted by eruptions is sulfur, in the form of sulfur dioxide gas. When it reaches the stratosphere, it turns into sulfuric acid particles, which reflect the sun's rays, further reducing the amount of radiation reaching Earth's surface
The Sporer Minimum (1450-1540) and the Maunder Minimum (1645-1715). Both solar minimums coincided with (but did not cause) the coldest years of the Little Ice Age in parts of Europe.
Glaring omission: For tens of thousands of years the proxy data shows that CO2 level increases have lagged behind temperature increases by from 800 to several thousand years. Thus, rising temperatures cause an increase in CO2 levels. Most CO2 not locked up in plants, is in ocean water. Rising temperatures caused greater plant growth, and dying vegetation releases CO2, but the vast bulk of CO2 was released from the oceans when the water warmed.
I would've liked you to dive more into why this new study (Osman et al) should be more trusted than the older studies that showed recent cooling, for instance
Which study shows recent cooling? If you mean recent in the past 200 years these studies are quite useless, because we have exactly measured temperetur recordings for this time period and they show it is warming right now.
Oh, they are even MORE super sciency. It's settled now.
@@fable4315 200 years eh? Do you understand how microscopic that looks on the timeline of evolution of our atmosphere?
cite name/ year / title ?
lets discuss
Fascinating that no one speaks about the fluctuations in the sun's output or volcano output both directly effect the temperature of the world
They actually do. A lot. Have you read any of these studies? Any climate-related ones? A study period? That's ok, 3rd hand sources written by propagandists who tell you things like "no one considers the actual fucking ball of energy in the sky when talking about how much energy the earth captures" are good too.
@@Chris-io2cs Okay, but let's recognize that the study from this video he is commenting on does not allocate any of the warming to solar causes, supporting his point.
@@danielmatthews1522 ok fine I suppose I will just concede that because this video doesn't mention it no one ever has thus justifying an off-topic red herring designed solely to undermine the credibility of the whole concept.
@@Chris-io2cs Gotcha, all good he was broad in his opener.
If we still haven't reached the temperatures or sea levels of the previous cycles it would make sense we hadn't seen these temps recently. if the earth was actually cooling for a thousand years then reversed and started warming again quickly like the previous graph then i would be much more worried. we have seen these temperatures and higher naturally the last five ice age cycles and their peaks were very short and spikey.
Ice core and sea floor mud samples show we are no where near temperature minimum or maximum over the last 400,000 years. Technically speaking we are still coming out of the last ice age from 12000 years ago. That isn’t that last ago in overall age of the earth. Climate change is inevitable and not an emergency. Irreversible environmental change like deforestation, resource depletion,strip mining, etc is the problem but climate change is “proxy measurement” used to address it and its doing a terrible job at it. Until we get money out of the renewable energy sector and approach ever industry that doesn’t have a sustainable element to it or an ability to reuse or repurpose its resources-our planet is dead
Hate that YT is censoring replies.
That, ladies and gents, is what we call bulls*** 😌
CO2 and methane are greenhouse gases and keep long and short-wave radiation bottled in the lower troposphere, raising global temperatures, including surface temperatures. We KNOW that’s a scientific fact.
The burning of fossil fuels releases a measurable amount of CO2 into the atmosphere. Methane from livestock operations also is measurable. When the earth warms as a result of this, it creates a positive feedback loop: because as the earth warms, it melts more ice (some of which releases even more methane), and reduces earth’s albedo (reflectivity), along with other positive feedback measures, which further warms the earth and so on.
The sudden punctuated rising of temperature with this latest “hockey stick” shows very clearly that there was relatively consistent global temps right up until the industrial revolution, in which humans have been pumping greenhouse gases into the atmosphere like no tomorrow.
TLDR: Yes, I am worried. Because the science shows troubling warming trends, 1,000s of people are dying around the world right now due to this warming, and leads to drought. So yes, I am worried. You should be too.
The big driver for the last three million years has been the Milankovic cycles. This an orbital "wobble" that repeats every 120,000 years. When closer, things warm a little, at the other end, things are a bit cold. We are a little past the very warmest bit of that cycle by only a thousand or so years and can expect things to cool by a degree every five thousand years or so.
Instead we gained a degree in a century.
Over the two or three million years covered by the Vostok cores, CO2 never exceeded 300ppm. We are 50% higher. with a known physical mechanism tying CO2 to heat retention.
Could be some clues there.
@@aaroncosier735 There’s never been a time in history when a person couldn’t cherry pick some data to prove any point they feel like. Stop feeling like a climate liar. The Mayas are extinct because of a crazy drought hundreds of years ago before any fossil fuel or man made pollution. Just stop already with your lies!
This is very good reanalysis work! Thanks for informing me!
I recommend another video: IPCC pressure tactics exposed: A Climategate Backgrounder
You can't honestly still be promoting that long-debunked slander. It was a totally false and dishonest characterization of Mann's work which was investigated by a dozen official and journalistic organizations and found to be bogus.
Have to ask why there is so much literature available with good documentation that completely refutes the whole man caused climate change idea?
because you don't understand what good documentation actually is?
@@bcwbcw3741 really, when the author references multiple documents and articles and provides links to them so you can read them and get the full context. Also provides links to all the studies and reports cited in their work.
Does that not constitute at least reasonably good documentation?
@@bcwbcw3741 perhaps you're just blinded by what you have been convinced you should believe!?
@@racetime1960 If you want to understand whether your "good documentation" is any good you should start by looking at the papers that disagree with your "refutation," not the self serving citations in these papers that agree with the authors. Unless you can understand the papers that disagree and show how they are wrong then your refutation is meaningless. The mechanism of heat trapping by CO2 is well understood, unless you can show how that additional trapping can take place and not change the earth's temperature then you haven't refuted anything.
@@bcwbcw3741 or you can explain how the atmosphere is big enough and complex enough that CO2, comprising a very small percentage of the atmospheric gases won't have that great an effect on the planets temperature.
And, if you realise that none of the predictive climate models work in the end and that none of the doomsday predictions has come about.
Oh, and the papers you say I should read are cited and links provided to the documents in question.
See, it's not that hard, with just a little effort, to understand that the "climate catastrophe" is in fact a fairytale.
The top "climategate" video on RUclips is presently a Cato Institute talking head on Fox News. So yes, please make something to fill this particular data void.
Here's all you need to know ; Mann et al decided to fake a bunch of data. Class dismissed.
@@notacommie7154 How did they fake data lol
@@LisaBeergutHolst by applying arbitrary " corrections". Among others. Like out right lying. This new chart is an example. Agenda driven " science".
@@notacommie7154 How do you know the corrections are "arbitrary" lol
@@LisaBeergutHolst because they always reinforce the lie. Prima facie evidence.
Reanalysis is still flawed if the input proxies are not good. There is still no good explanation as to why the medieval warm period was local when it may have stretched half way across the northern hemisphere. So why does the reanalysis not explain how barley was grown in Greenland? In any case, why do we think that a bit of warming is a bad thing and that the current condition is optimum?
Excellent, Simon. Great presentation. Thank you.
Your mango proxy was really a nice example. You could have added some error bars to show an example for statistical uncertainty as well.
I don't like it when two different methods to measure the same thing give different results where their error bars don't at least come close.
It basicly means that at least one of the methods has something wrong.
Don't worry, NASA and other broken US institutions will do their part to make whatever outcome the politicians want. So sad to see people fall for this crap continuously. When the East Anglia emails were leaked (discussing how best to fake data since none of the predictions were panning out), the British government told the world that the emails and their contents didn't count or didn't exist because they were stolen (hacked). If that is "British Common Sense" then those people have none.
The elimination of the MWP and EMP variations weren't mistakes due to data interpretation, they were an outright and fraudulent attempt to deceive and make modern variations seem more significant.
It is also extremely short-sighted to surmise that warmth (temperature) is the only thing that affects the width of tree ring bands, as they are also affected significantly by other characteristics of the climate, such as moisture, the amount of actual sunlight received, and the amount of nutrients (mostly C02 and nitrogen) available in the atmosphere.
'The elimination of the MWP and EMP variations weren't mistakes due to data interpretation, they were an outright and fraudulent attempt to deceive and make modern variations seem more significant.'
The MWP variation was never eliminated, let alone fraudulently, because there was never any substantial evidence of its existence globally.
Simon Clark mistakenly presents the graph at 3:47 showing a pronounced Medieval Warm Period as a global record. It is in fact an approximation of temperatures in Central England from Lamb 1965, using historical documents and vineyard distribution. Thus not only does it represent a very small area (Lamb himself thought the Medieval Warm Period was a largely European phenomenon) its methods are thin compared to the huge amount of evidence that has accumulated since, or even compared to MBH 99.
'It is also extremely short-sighted to surmise that warmth (temperature) is the only thing that affects the width of tree ring bands.'
It is true that there are uncertainties, which dendrologists are well aware of. But the reliability of tree rings as proxies to a fair degree is confirmed by the fact that they correlate with the surface temperature record from 1850 up until around 1980 (after which there is the divergence problem). They are also roughly confirmed by any number of other proxies such as corals, boreholes, stalagmites and ice cores.
Here is something of an explanation. For the confounding factors you name, CO2 levels were very stable over the past 1000 years up until around 1900. Nitrogen (which plants get from the soil) would also be fairly stable in uncultivated areas. So it is unlikely these have confounded the record. As for rainfall and sunshine, apparently rainfall is a bigger factor while sunshine plays a smaller role. Dendrologists reduce uncertainty regarding rainfall by going to the upper slopes of mountains for temperature variation (since rainfall is likely to be in excess). Botanical experiments can also be conducted to isolate the effects of variables like rainfall and sunshine.
My pumpkins agree entirely and so do my tomatoes. This year has been pure crap for the tomatoes but the pumpkins are headed for the Guiness book of records - god knows why. More important perhaps - the half life of atmospheric CO2 is a mere 13 or so years. If it were man made we would see significant fluctuations in the levels and strong regional effects but we observe neither - implying (as several studies of historical data have also concluded) it is more likely to be the consequence of global warming than a major cause. There are other well known causes of regional and global warming that are always ignored: one of them is atmospheric particulates and sulphur oxides. These were reduced by the switch froom coal to oil, reduced again by Clean Air Acts around the world, reduced again by catalytic converters and finally reduced once again by deindustrialisation - especially in the north Atlantic. We therefore have a very neat irony in that the only mechanism that can be clearly linked to warmer temperatures is climate change hysteria.
@@kubhlaikhan2015
@@kilometreman Also, the original Lamb diagram in the first IPCC report did not have any numbers on the temperature scale. It was described as a 'schematic' not a quantitative graph and was for central England, not the globe.
@@pshehan1 Thanks!