Logistic Regression Details Pt 2: Maximum Likelihood

HTML-код
- Опубликовано: 10 июн 2018
- This video follows from where we left off in Part 1 in this series on the details of Logistic Regression. This time we're going to talk about how the squiggly line is optimized to best fit the data.
NOTE: This StatQuest assumes that you are already familiar with Part 1 in this series, Logistic Regression Details Pt1: Coefficients:
• Logistic Regression De...
For a complete index of all the StatQuest videos, check out:
statquest.org/video-index/
If you'd like to support StatQuest, please consider...
Buying The StatQuest Illustrated Guide to Machine Learning!!!
PDF - statquest.gumroad.com/l/wvtmc
Paperback - www.amazon.com/dp/B09ZCKR4H6
Kindle eBook - www.amazon.com/dp/B09ZG79HXC
Patreon: / statquest
...or...
RUclips Membership: / @statquest
...a cool StatQuest t-shirt or sweatshirt:
shop.spreadshirt.com/statques...
...buying one or two of my songs (or go large and get a whole album!)
joshuastarmer.bandcamp.com/
...or just donating to StatQuest!
www.paypal.me/statquest
Lastly, if you want to keep up with me as I research and create new StatQuests, follow me on twitter:
/ joshuastarmer
#statquest #logistic #MLE


NOTE: In statistics, machine learning and most programming languages, the default base for the log() function is 'e'. In other words, when I write, "log()", I mean "natural log()", or "ln()". Thus, the log to the base 'e' of 2.717 = 1.
Support StatQuest by buying my book The StatQuest Illustrated Guide to Machine Learning or a Study Guide or Merch!!! statquest.org/statquest-store/
So why don't you write e^log(odds) as odds directly. Why do you need to keep the exponent as it is? P=odds/(1+odds)
@@rkbshiva Because often times we have a value, x, that is equal to log(odds). So, essentially, we have e^x, and the equality is not as obvious.
@@statquest Thanks for the explanation Josh...I also want to thank you for the immense contribution you are making by publishing such quality educational content for free!
Had 1 doubt
Is maximum-likelihood different from the cost function where we use gradient descent?
@@anurodhchoudhary1689 You can probably multiple the likelihood by -1 and end up with a cost function that you can minimize with gradient descent.
Dear Josh, I want you to know that there are many of us who are so thankful to have you.
Thank you very much! :)
Count me in
Count me in
This is where our tuition fees should have gone to.
:)
Exactly
This explanation is so good that I feel kinda guilty for having access to it. There is no doubt that if people in the past had access to this, then their lives would've been a lot easier. I feel like a spoiled brat. This explanation is too good for this world.
Thank you very much! :)
@@statquest I too feel guilty for having access to such great learning at no cost. Once I get job as ML engineer will donate 1000 dollars. Till then I will never skip your any ads does that help?
@@raj-nz4bj That's awesome and thank you for your support!!!
@Rakesh Shaw DS The algorithm mentioned at 9:01 probably refers to "Gradient Descent", you can select some initial values for the intercept and the slope for the candidate line and let Gradient Descent find the line with the best fit.
Easily the most intuitive and detailed explanation of logistic regression + max likelihood on the web. period.
Thank you very much! :)
Yes
@@arundas7760 Thanks! :)
In the past one year of my MBA, I have been taught concepts of logistic regression by Math PhDs and Analytics Gurus, but no one could beat the simplicity and elegance of your explanation.
BAM! :)
Dear Josh, your videos are amazing and I would have never passed my qualification exam without them. Also, this is the first time I actually understood how MLE works. Thank you so much!
Hooray and congratulations!
You're straight up G, Josh ! Keep up the great work, I hope you sell loads of your songs and really grow Statquest to the next level !
Thank you so much! :)
this is called GENIUS AT TEACHING !!
I teach graduate level operations research courses which require some understanding of probability and statistics. My students really had limited understanding of some fundamental knowledge even if they took some related courses before. I found your videos organized and concise. I will recommend your channel to my future students. Thank you, Josh!
Awesome! Thanks!
The best explanation ever on logistic regression which includes every details. Thanks a lot Josh, i adore you so much!
Thank you very much! :)
Brilliant!! From the very depth...explanation is splendid..this is all i wanted! Thank you so much
I must say you are a magician. You have the tricks to communicate and deliver just what people want. We want more like you. Thank you so much in shaping the world.
Thank you! :)
This was so helpful! You explained the likelihood really intuitively (calculate likelihood of this data given shape of the squiggle) and it makes a lot of sense now. thank you!!!
Hooray! Thank you very much! :)
This is the first time I clearly understood Maximum Likelihood and Logistic Regression. Thanks for your videos.
Awesome! :)
Thanks so much, stats doesn't seem so hard any more with your videos. You truly have a talent for teaching :)
Thank you!!! :)
Hi Josh.. I hope you know how you are changing people's life directly.. a lot of people are earning very good salary bz of your quality content.. if one person gets a job, his entirely family is getting benefited bz of him.. so, you are not just helping one single person but thousands of families.. May the almighty bless you and keep you happy, healthy and wise..
Wow! Thank you very much! It's great to hear! BAM! :)
This dude is a saint. These videos really condense the ideas to some easy to follow steps.
Thanks! :)
Thank you for this. You make our life easier, especially for data analytics students like me. Your explanations are so great that is s easy to understand. Such a talent.
Thank you very much! :)
This is my new favourite channel for ML really love the explanations and the speed at which you talk is easy to follow. I am a person who learns by examples so it would be great if you added more examples. Thanks for the great content.
Thank you! :)
This was the best explanation on youtube. I wish I found this before. You’re awesome!
Thanks!!! I'm glad you like the video! :)
Words cannot express how grateful I am for this amazing explanation.
Wow, thank you!
These videos are amazing!! Congratulations on this fine job!
Thank you! :)
Hi Josh, you are single-handedly carrying me through my Masters program with your videos. I was seriously considering dropping out earlier this year cause I was having a lot of difficulty understanding anything, but a lot of things are starting to click now thanks to you. Your vids are a godsend to students everywhere.
I'm glad my videos are helpful! :)
@@statquest josh how many times we should do trail and error process in order to fit the squizzle to the data for linear regression there is a direct formulae using matrices to find the slope and the intercept is there any formulae to determinre the curve ....we cant perform the operation these many times
@@GireeshAbburi The squiggle can be optimized using Gradient Descent: ruclips.net/video/sDv4f4s2SB8/видео.html
@@statquest could u please explain
It detailed what is gradient descent
@@GireeshAbburi I explain how gradient descent works here: ruclips.net/video/sDv4f4s2SB8/видео.html
I wish I could see the backend efforts you put to make concepts so easy I understood all concepts god bless you bro
Thank you! Yes, it takes a lot of time and work to make a video. I spend a lot of time researching a subject and then a lot of time trying to find a new way to present the information.
well, this is the second channel i want to watch alllll of the videos.. thank you for your enthusiasm and good illustration of concepts🥰
Thank you! :)
You are an awesome teacher!!! Thank you for the visualizations during your teaching, it helps to learn the concept so well!!
Glad it was helpful!
I just discover your channel and it is one of the way to learn stats! Thank you so much!
Thanks! :)
Finding this channel was a pure blessing, especially now that my econometrics classes are held online due to the pandemic and it’s even harder to understand the material. Thank you so much providing free content with such a high academic value (and with very lovely jingles too)!
Thanks and good luck with your econometrics course.
@@statquest I really loved all your videos but when I was trying to apply hyperparameter tuning for logistic regression, I was unable to understand what is a ( penalty, C). I searched and got to know that penalty is the cost function, but in all your videos on logistic regression u didn't mention about cost function, can u please tell help me out in answering?
@@nitishkumar-bk8kd The "cost" function for logistic regression is the negative log-likelihood (it is simply -1 times the log-likelihood described in this video. We can either maximize the likelihood with the log-likelihood, or, if we multiply the log-likelihood by -1, we can minimize the "cost").
However, what language are you using? Python? In python 'C' is the inverse to the regularization strength. If you want to learn about regularization, see: ruclips.net/video/Q81RR3yKn30/видео.html
@@statquest Thanks for your reply professor josh, I am happy u replied to me :) but still, I have a doubt :(
you are telling me that the cost function is -1*log(likelihood) of the data right? if so why didn't you multiply the log(likelihood) of the data with -1 to find the best fit line for the data?
and in hyperparameters, the solver parameter have options like 'lbfgs' , 'newton-cg' , 'liblinear' , 'sag' , 'saga'
Each solver tries to find the parameter weights that minimize a cost function. how these are related with likelihood?
@@nitishkumar-bk8kd Logistic Regression has traditionally been solved by maximum likelihood, which is why my video describes that approach. It is only recently that we have general purpose code that minimizes cost functions and includes regularization. Thus, when people talk about the theory of optimizing logistic regression, which is what I do in this video, they talk about maximizing the log-likelihood. In practice, things are always a little different, especially if you are using one of the newer methods that include regularization. Unfortunately, the questions you are asking are really more appropriate for a "how to do logistic regression in Python" video (NOTE: I already have a "how to do logistic regression in R" video: ruclips.net/video/C4N3_XJJ-jU/видео.html ) and I'll keep that topic in mind for a future video.
I will be using these videos for the rest of my life. Thank you Josh
Bam! :)
Hi Josh, this is wonderful, thanks for your series of presentations. Very informative. Well understood!
Thank you very much! :)
Thank you very much Sir ! . Very informative ! . You're a great teacher. Quest ON!
Thank you! :)
So far, the best explanation of maximum likelihood estimation on RUclips. Log odds of me being better at math would be significantly high had you been my math teacher at highschool. Thanks Josh.
Thanks!
Thank you!!! Thank you!!! Thank you!! for your dedication on the videos, you are helping a lot!!
You are so welcome!
You are an amazing teacher!! Made it crystal clear!! Thank you soo much!! :)
Thank you! :)
Thanks Josh!! your channel is the best thing happen in my quarantine period :) love from India!
Hooray! :)
Your videos have cleared my basics . Thankyou for these ☺️☺️
You are welcome!! I'm glad you like the videos and that they help you. I'm really excited about the next video (R-squared and p-values for Logistic Regression). :)
Thank you. This is a genius way to explain the concept to a dummy like me. The rotating graph on 08:55 is icing on the cake.
Bam!
My first thought when learning about this was why couldn't we use least squares on the log odds thing graph, then straight away it's explained with the pos/neg infinity thing. Nice.
bam
Thank you so much for the excellent video. Keep up the good work.
Thank you! :)
One of the best videos on Logistic Regression.... Awesome...
In your words "Tripple BAM"... 😊
Glad you liked it!
Love your lessons so far.. FUN, engaging, and doesn't feel academic.. I'm only on my 3rd video.. Thanks !!
Glad you like them!
간단하고 명확한 설명 감사합니다! thank you!!
Love the likelihood series. Thanks!!
Hooray!!! I'm glad you like the videos! I'm excited about these as well.
I am your biggest fan. Thanks for explaining these things in a way they are understable. Thank you, thank you!!! :-)
Wow, thanks!
The minus sign may have been left out:
3:32 Should be (-)2.1
3:37 Should be (-)1.4
Thank you for producing this lesson!
That is correct. I left out a few minus signs. :(
Great video, thank you so much for clearly explaining the topic!
Glad it was helpful!
Superb!!!! What a explanation...
Thanks a lot 😊
The best tutorial on logistic regression
Thank you. :)
Glad you think so!
Coming from lecture from MIT on generalized linear model which was difficult to get a grasp, this series on logistic regression helps me understand GLM better. Thank you! I also wonder if you would make a video that deeper explains multinomial logistic regression.
I'll keep that in mind.
Fantastic video josh.... Clear cut explanation...
Thanks so much! :)
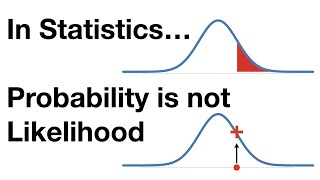
Hey Josh, I can only resonate everybody´s thankful words here. I can´t be more grateful. You make me think that statistics can be very daunting most of the time for the lack of experts like you that can really explain its details in a very simple way. For me, this is true sign of mastery! I had one question regarding this video though, based on your other video where you explain the difference between probability (P(data | mean, sd) )and likelihood (L (mean, sd| data)). Where the in the former you find the distribution of the data under a fixed hypothesis and the latter you find the best distribution that fit the data.
Somehow in this video about logistic regression i feel that you talk about the likelihood in terms of the probability. As in "the likelihood of that this mouse is obese [given the shape of the squiggle] is the same as the predicted probability." So here the likelihood of the data point (the mouse) is based on a fixed distribution? Could you explain that if you have time? :) Again, really appreciate all that you do!!!
In the probability vs likelihood video I'm specifically talking about the difference in probability and likelihood with respect to continuous probability distributions. In this case, the s-shaped squiggle is not a probability distribution (you can because the area under the squiggle, from 0 to positive infinity > 1). However, like in the probability vs likelihood video, likelihood still refers to the y-axis. The big difference, now, however, is that so does probability. Thus, thus, in this case (because the s-shaped squiggle is not a continuous probability distribution), both likelihood and probability are the same. That said, we choose to call it "likelihood" when we are fitting the squiggle to the data to be consistent with "maximum likelihood".
@@statquest Thanks very much for your answer, Josh! I understand what you mean that the squiggle is not a probability distribution. It is also pretty clear the overall of Maximum Likelihood Estimation: to find the squiggle that best fits the data. What remains unclear to me (which was pretty clear in your video likelihood vs probability) is how I should interpret MLE in formal terms: is it the highest probability (likelihood) achieved by the data given the squiggle (a case of p(y|Hi) or the highest probability given the data p(Hi|y). From your video and explanation I think it is the former?
@@bernardoleivas8296 Given that the data is fixed, and we're wiggling the squiggle to fit it best, we want to maximize the likelihood by changing the parameters determine the shape of the squiggle (the slope and intercept in log(odds) space) given the data.
@@statquest okay! Again, Thank you very much for the amazing content =)
When you use the train data to derive the coefs, how do you know the log-odds from the binary response in the train data set? in 3:31, how do you get the log(odds) for the first response is -2.1? How do you derive that candidate line? To get log(odds) we have to know p(y=1) right? When you train the model, you actually dont have know how to convert binary (0,1) response to p(y=1). I am wondering is the candidate line used to project the data from binary to log(odds) selected by random, then we keep improve it?
The candidate line is just a randomly selected line - it's a starting point that is then improved on by using maximum likelihood. So you start with a guess, calculate the likelihood of that guess, and then move the line - change the slope and change the intercept - and see if that gives you a higher or lower likelihood. If the likelihood is lower, then you move the line in the other direction. If it's higher, you keep moving in that same direction. Does that make sense?
@@statquest Yes! Thanks very much
Thanks for this question and answer, Zhihao & Josh
@@statquest BAM!!
Thanks a lot for making this video, your the best.
Thank you! :)
I am student of data science, when i see this logistic algorithm calculation , i am scared and think that i could survive in this field or not, But after seeing your content of this algorithm i gonna play with this .Thankyou so much sir for this valuable content
Thanks!
Thank you so much for this great video!
Thanks!
This is a brilliant video - in-depth discussion of how to fit a logistic regression line for non-mathematicians. Do consider creating a lesson giving more details of the conversion between the squiggle and the log-likelihood graph. Bet it will be awesome! BAM :) PS - purchased all your lesson :)
Awesome!!! Thank you very much!!! Have you seen the other videos in this series, they also describe the conversion between the squiggle and the log-likelihood. See: ruclips.net/p/PLblh5JKOoLUKxzEP5HA2d-Li7IJkHfXSe
This is awesome, thank you so much
Thanks!
Your videos are AWESOME.
Thank you very much! :)
You are too good. All the best wishes for the good work.
Thank you so much 😀!
Hey Josh,
I really like your explanations but the logistic regression is where i got stuck real bad. But it's clear now.
The problem is that you never linked the log(odds) and line equation. I saw from the internet that there's a link function between them and that's how we can use line equation in place of log(odds). If you'd have included that explanation as well, i'd have not depended on other explanations. But anyways thank you, am always a fan of your explanations. Keep up the good work!!!!
BAAAMMM!!!!!
You need to learn Binomial distribution, Bernoulli trial, likelihood, MLE, loss function, Gradient Descent, odds, log(odds), Logit function, sigmoid function, decision boundary, and expected values. And of course the mathematical intuitions too. This is overwhelming for a beginner like me. But Josh your part 1 and 2 of Logistic regression solves many problems for me. Thank you and a lot more to learn from you. BAM!!!
Dear josh, I have a question too. Is this Maximum likelihood equivalent to loss function?
That's the idea. However, to make it "loss" and something we want to minimize, we multiply the likelihood by -1.
Best explanation for this concept in the internet, most just say: "a bunch of iterative stuff that statistical software do" -_- ! Thanks again sir!
Hooray!!! You're welcome. :)
Liking the video immediately after the song!!
BAM! :)
Thank you so much! I love those visualizations. It would be awesome if you could explain some questions I had when I
was in school(some are interview questions):
1) the data is binary when they were plotted I can only see 0 and 1s where does the probability come from? since you compares it with linear regression.
2) Why not just fit a straight line, like linear regression, to binary data instead of a squiggle? What's the impact if we do this?
3)Why no error term in logistic regression?
4)Why do we want to use logit?
I'm not sure, maybe this can help: www.datasciencecentral.com/profiles/blogs/why-you-should-never-run-a-logistic-regression-unless-you-have-to
Fantastic explanation!!
Bam! :)
Thankyou so much for all your videos! Pls keep posting!
You are welcome! I've got Part 3 of this series coming out tomorrow. It explains a type of R-squared and the associated p-value for logistic regression.
THANK YOU SO MUCH. l really appreciate your tired for present the best videos. l need from you so much to keep this work in logistic regression, please.
Hooray! I should have my next video out in just a few hours. :)
StatQuest with Josh Starmer looking forward to it!!😀
Hooray! I just posted it!: ruclips.net/video/xxFYro8QuXA/видео.html
Hello Josh,
first of all I wanted to thank you for these enormously helpful, world class educational videos. They are my lifeboat at the moment in my "Data Literacy" class.
One thing I noticed was: @3:35 it should say -1.4. This is not irrelivant since the "fancy looking formula" produces values closer to 0 for negative values.
Again, thank you so much for what you did here. I would probably have to go back to copying slides by hand which omit all the details and assume way to much
previous knowledge.
Best
Markus
Thanks!
Clearly explained. Good job
Thanks! :)
Great tutorials.
Something I missed: in previous video the probability was used to calculate the Log. Here the Log(odd) is used to calculate back the probabilities. I guess that 80-85 kg individuals were clinically distributed to obese/not-obese and this ratio provides the probability for this weight range. So, why we need to convert to log, and back, as probabilities are the raw data?
It's relatively easy to fit lines to things, and relatively hard to fit squiggles. So we use the log() space to fit a line to the data and then translate that back to probabilities (and a squiggly line).
It seems to prove a useful model. Thankyou
:)
Just amazing!
Thanks!
Thank you very much for another cool video!
I have a question if you allow me to ask it: isn't the linear function that you derived from the logistic function the perfect choice because you have already derived its values and drew it using the values of the first logistic function (which happened to be the squiggle found using maximum likelihood)?
I'm not sure I understand the question. The line the video is just and example, there could be many others - some better than others. So that straight line is rotated until it has the maximum likelihood. Does that help? If not, can you clarify your question and give me a time point in the video that is confusing you?
Josh, do you have have a video for multivariate logistic regression? wondering how multi discrete or even mixed discrete and continuous logistic regression works. Thank you so much!
BAM !!!! I just found a gem of a teacher.
Hooray!
@ 10:00 the fact that we both said cool at the same time was pretty cool
Double Cool!!! :)
Thank you sooooo much!!!!
Glad it helped!
Thank you sir your video awesome and help me clearly understand the logistics regression
Thanks! :)
this was soooo good
bam!
You're awesome! Thank you very much
Thank you! :)
This Logistic Regression series is one of the best means I've found online for understanding the theoretical foundations behind those models in a simple way. In both Linear and Logistic Regression, you reference the idea of iterating and optimizing the line. Do you imply the usage of Gradient Descent? Do you consider solving those problems using partial derivatives less relevant?
I'm glad you like my videos! I use the concept of "iterating and optimizing" more just to convey the concept that some lines fit better than others and that one possible way to find a solution is to step towards the best fitting line. However, in practice, other solutions can be used more efficiently.
I use your method of log-odds in my question but not satisfied. May I calculate coefficient using Eviews software? Eviews shows the same coefficients in logistic as well as in linear and on fitted line but coefficient calculating from log-odds is not same to above stated? Where I'm doing wrong?
Ah - are you trying to recreate the numbers in this StatQuest? That's not a good idea - there is so much rounding and what not that I doubt you can recreate it. If you want to recreate an analysis, I would recreate the one I did in this video: statquest.org/2018/07/23/statquest-logistic-regression-in-r/
Hey Josh. Nice video.
Have a question on equation in 4.11, when using exponential on both sides to cancel the log. Shouldn't the log disappear on both sides?
Good eye!!! Yes, you could make the log disappear on both sides, since e^log(odds) = odds. However, you can also just leave "e^log(odds)" as is, and by doing that, you end up with a standard equation that you'll see in textbooks and elsewhere. So, I choose to leave it as is so that when people see the equation elsewhere, they will recognize it from this video.
Thank you!!
Welcome!
Could you please explain the feature selection process for logistic regression
You are Stats God!! Thank you 🙇🏻♀
:)
I can’t like this video enough!!
Hooray! :)
Exceptional.
Thanks!
These StatQuest videos are giving me Homestar Runner vibes... but educational
TROGDOR!!! :)
THANK YOU DOC!
:)
Values of betas remain same in logistic regression which we obtain by using linear regression formulas??
I want to clear that value of intercept and coefficients using in logistic are those which we obtain using regression formulas or in liner fitted line?
Amazing you are!!
Thanks!
With regression, I can draw a line following the line equation f(x) = ax+b.
I wonder why the sigmoid equation is not used here f(x)=1/(1+e^-a). How can I draw it ?
The sigmoid function is non-linear - and that makes it harder to solve (and prior to computers, pretty much impossible). So that's why the math is done in linear space and then transformed to the logistic curve - it made the whole thing solvable back before high speed computers.
So useful .... Thanks
Such a WoW!!! Perfect
Thanks!
The song reminds me of Pheobe! Jokes apart, I really loved the series.
Thanks! And check out this theme song... ruclips.net/video/D0efHEJsfHo/видео.html
what to do when there's no maximum from the MLE? (linearly separable data)
That's a great question and I don't know the answer to it. There may be some non-linear method that would work, or some transformation, but I don't know off the top of my head.
Nicely done
Thank you! :)
Really Helpfull!!!
Thanks! :)
Excuse me if this was explained in the video(I guess it went over my head), but I have one question:
At 3:51 we already have a squiggle with data points projected onto it. Then we transform it with log(p/(1-p)) and then we transform it back to the squiggle. I wonder why is this done, couldn't we automatically get the probabilities by projecting the data onto the squiggle?
Sometimes I think I understand why it's needed to transform the data but it just doesn't click. Could you please elaborate?
We start with a random straight line in the log(odds) space (on the right side of the screen). However, in order to evaluate that line, we need to calculate residuals - and we can't do that in the log(odds) space since the training (known) data is at -infinity and +infinity. So we transform it into probability space (on the left side) so we can calculate the residuals and evaluate the straight line on the right. We then rotate the straight line, transform and evaluate to see if we the rotated line is improving it's fit, etc.