Speed - Time Graphs

HTML-код
- Опубликовано: 6 мар 2024
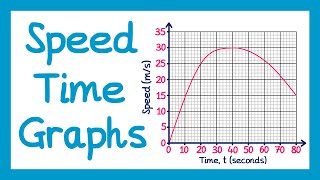
- Let's take a look at speed and time graphs and see what they tell you. A speed- time graph is a visual picture of both constant acceleration, constant deceleration, and no acceleration.
In order to calculate the acceleration on the graph you will find the gradient of the line. The gradient of the line is the same as the acceleration which is change in speed over change in time.  Кино
Кино


I have a question why we sometimes see full moon, sometimes half and sometimes nothing? Like in 15 days we see full
New Moon is dark, so maybe when you see nothing it is because you can't see the new moon.