How To Find Calculate Determine How Many Classes And Class Limits Width For A Frequency Distribution

HTML-код
- Опубликовано: 15 июл 2024
- In this video we discuss how to calculate or determine how many classes to use, and how to calculate the class limits for a frequency distribution.
Transcript/notes
How many classes and class limits for frequency distribution
In a past video we discussed what a frequency distribution is. Real quick, you have a data set, you break the data down into classes or intervals, column 1 which we will go in depth on in a minute, then you tally up how many data points are in each class, column 2, and you write that number down, which is the frequency, column 3.
So, how do we know how many classes to use and how to find the limits of each of the classes?
The first thing you have to determine is the number of classes. This number is usually between 5 and 20, the larger the data set, the more classes you should have, the number of classes is really about having enough of them to show patterns in the data.
There is no set in stone way to determine how many classes to use, but, one way is to use the equation 2 to the k is greater than or equal to n. Where k is what we want to find, the number of classes and n is the total number of data points in the data set, which in this case is 75.
Our main equation looks like this and we want to find the first time this equation becomes true, so we can start with 1, and plug in values for k. k=1, we get 2, k=2 we get 4, k=3 we get 8, k=4 we get 16, k=5 we get 32, k=6 we get 64, k=7 we get 128, ding ding. The equation is now true, so in this example we will use 7 classes.
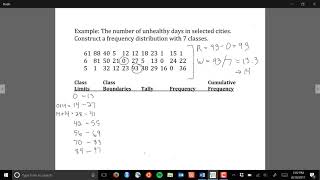
Next we need to find the class width, and to do this we are going to use the equation width equals the range divided by the number of classes. The range is the difference between the highest value in the data set and the lowest value in the data set. In this data set the highest value is 466 and the lowest value is 126, so the range equals 466 - 126, which equals 340. Now we take that 340 and divide it by the number of classes, 7, and we get 48.57. We are going to round up to the nearest whole number, which is 49. So, 49 is our class width.
A little note, always round up when determining class width, for example if you calculated a class width to be 26.12, round up to 27. Rounding up is different than rounding off. And if you get a whole number with no decimal value as your class width, say you got 34, go up to the next whole number, 35, as this will give you enough space in the frequency distribution for all of the data values.
Next is to get a starting point for the lowest class limit. The minimum data entry is a convenient lower limit for the first class. In this data set that number is 126.
Next is to get the lower class limits for the remaining 6 classes, and to do this we just add the class width, 49 that we calculated earlier, to the value of the previous class’s lower limit. Again, the first classes lower limit is 126, the second classes lower limit would then be 126 + 49, which is 175. To get the lower limit for the third class, we take the lower limit of the second class, 175 and add the class width, 49, and get 224. And then continue this process to get the lower limits for the remaining 4 classes, 273, 322, 371, and 420.
To get the upper class limits for each of the classes, you subtract 1 from the next classes lower limit. So, for the upper limit of class 1, we will take the lower limit of class 2, 224 and subtract 1, which gives us 223. For the upper limit of class 2, we will take the lower limit of class 3, 273 and subtract 1, which gives us 272.
The next classes would be 322 - 1, 371 - 1, 420 - 1, and for the 7th and final class, since we don’t have a next class up to use the lower class limit from, we are going to take our lower class limit of the 7th class, 420 and add the class width of 49 and then subtract 1, which gives us 468.
So, now we have the class limits for all of our classes and we can organize them in a table like this.
Next you would tally up the data points in each of the classes, write that number in a frequency column, add in a relative frequency column, which basically shows you the percentages of values in each class, and walla, your frequency distribution is complete. I have another video that covers this process more in depth which I will link in the description below and at the end of this video.
Timestamps
0:00 Quick Review Of Frequency Distributions
0:23 Common Rules For The Number Of Classes
0:40 Formula Used For The Number Of Classes
0:55 Formula Example Explained
1:21 Formula For Class Width
2:21 How To Find Lower Class Limits
3:09 How To Find Upper Class Limits


You’re an ANGEL!!! You explained this so easily
😁This was an awesome video and easy to understand. I was very frustrated with the few examples given in my class and I did not understand. Thank you!!!!
I'm doing math and in uni and I finished high school last year. We got a group assessment that needed this and we basically never learnt about it in high school, but you made it simple from the start. Thank you, man🙏🏾
I really needed to see this video. It helped me out a lot! Thank you!
thanks man you brightened my day it was really long and you made something that was seemingly difficult make so much sense thanks man
Thank you for this great video lesson!
Saved my life. God bless you
This is so helpful thank you!
This is so helpful to my module. Thank You❤️🥰
This was most helpful!!!
THANKS FOR THE HELP❤️
thank you very well explained...
thank you very much, it helped me a lot
'liked'. Thank you for the video.
Thank you, it’s very useful
really great video thanks
Its so good for me to do homework .thankssssssss
Thx ✨️
THANK YOU!!!!!
THANK YOU SO MUCH.... I PASSED THE EXAM AND I AVOIDED MY MOM BEING ANGRY AT ME... I OWE YOU SO MUCH
Awesome, great to hear that!
Thank you for breaking it down.
You bet Misty, thanks for watching.
Thank you very muchh Sir 🥺🧡
thanks it is useful
Thanks❤️
thank u!
This was very clear, can you please do one for data with decimals and one for data that contains both whole numbers and decimals? I`m so confused!
bruh thank you!!
Thanks, I gonna use it in part of my master's degree analysis!
There are other alternatives?
What's the name for that approach?
Thank you so much next class Please
thank youu
Hi, I'm dealing with raw data in decimal points and calculated class width is 0.7625 ,with the condition that i should make 8 classes starting from 0.1. The smallest value in the data is 0.2 and largest is 6.3 what should be the class width that will suit this problem?
Is this for grouped or simple only?
sir in the class with the smallest data set of 1 and highest is 40... I guess the computation for the classes is not applicable?
thanks you
Still made no sense to me..
wow
Where do you get the tally’s from
I have a question. In the activity that were given to us, the said classes we should have is 6. but that would mean one element would be left out. The sixth class is 42-48, but there's a score that is 49. question, do i create another class? or just leave 49 out?
if i create another class, k = 7 but all the observations are counted
but if i leave the 49 out, there will be one missing but i satisfied that i have 6 classes.
im rlly confused
What's the minimum or lowest class limit if 49 is your maximum? You need to decrease your lowest class limit. Say for example your lowest class limit is 23 you need to decrease it to 20 and that will serve as the starting point in your frequency distribution table.
What if i got 0.44, to which number do I round it up to? 1 or 0.5? Max=4.7 Min=1.6 and number of classes is 7.
The lower class limit are wrong
And also how to use the Pivot Table in Excel to create class intervals, please and thank you!
Where do you even get 2k>=n and how did you get to multiplying it to get answer, literally been I stats class x2 and failed x2 I just don't understand this
The 2k stuff is mostly taught in old statistics lectures.
isn't the highest value 468 and not 466 I'm a bit confused
Hey Study Channel, the highest value in the data set is 466. The class limit in class 7 is 468, which can be greater than the highest value in the data set.
Uhhhhh mate in the Frequency Distribution you're going by 48 not 49 1:54
Im confusing !
Still confused
this is so helpful thank you!!