nanoparticles size from SEM images - 02

HTML-код
- Опубликовано: 2 окт 2024
- Reference:www.sciencedir...
In this video, I have shown how to calculate Nanoparticles/nanowires/nanorods/ nanosphere size using ImageJ and Origin software. For this calculation, I have used a proper way. I'm uploading this video at the request of one of our viewers.
If you have any questions, ask me in the comment section below.
For more videos, please subscribe to my channel. Thank you.
#NanoWorld
__________________________________________________
ImageJ software downloading link
wsr.imagej.net/...
__________________________________________________
For more updates follow us on,
Facebook: / fascinatingnanoworld
Twitter: / nanoworld8
Instagram: / nanoworld85
Contact: fascinatingnanoworld@gmail.com
_________________________________________________
Interpretation of SAED pattern | estimation of d-spacing & (khl) values
• Interpretation of SAED...
How to put a scale bar on SEM & TEM images (SEM/TEM data analysis)
• How to put a scale bar...
No valid atomic position available (Rietveld refinement through X’pert Highscore)
• Fixing of valid atomic...
Negative intensities in scan data points (Rietveld refinement through X’pert Highscore)
• Fixing of Negative int...
Indexing XRD peaks with Miller indices (hkl) values using X’pert Highscore software
• Indexing XRD peaks wit...
How to plot JCPDS card with the XRD data using OriginLab software
• How to plot JCPDS card...
XRD data analysis using X’pert Highscore software
• XRD data analysis usin...
Deconvolution of photoluminescence PL spectra (PL peaks fitting)
• Deconvolution of photo...
How to find peak position and FWHM of XRD data
• How to find peak posit...
How to calculate crystallites (grain) size from XRD data?
• Crystallites (grain) s...
Estimation of grain size through modifies Scherrer equation
• Grain (crystallites) s...
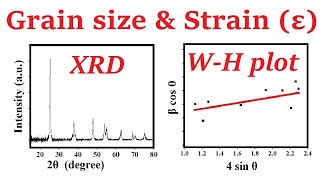
Crystallites size and strain using W-H plot method
• crystallites (grain) s...
Calculation of nanoparticle size through SEM image
• nanoparticles size fro...
How to find Miller indices of XRD peaks?
• How to label XRD peaks...
How to calculate d-spacing from XRD data?
• How to calculate d-spa...
How to calculate lattice constant (a, b, c) values from the XRD data?
• How to calculate latti...
How to calculate microstrain and dislocation density from XRD data?
• strain and dislocation...
How to calculate crystallinity from XRD data?
• how to calculate cryst...
How to smooth XRD data?
• How to smooth data (XR...
Baseline correction for XRD data
• Baseline correction fo...
Cyclic Voltammetry Data Analysis
• CV Data Analysis throu...
How to find bandgap energy using the Tauc plot method?
• Band gap energy from a...
How to calculate bandgap energy using the Kubelka Munk function?
• Bandgap energy using K...
Understanding Tauc plot, 1240 (constant) and 2.303 constant
• Band gap energy (Tauc ...
How to know a material either have direct or indirect bandgap energy?
• How to know a material...
DSC Data Analysis
• DSC Analysis Through O...
TGA Data Analysis
• TGA Analysis Through O...
How to plot the double Y-axis in a single graph?
• TGA & DSC double plot ...
Electron paramagnetic resonance (EPR) data analysis (calculation of g-factor)
• Electron paramagnetic ...
_________________________________________
Music Source
Unconditionally by Broken Elegance 🎩 / brokenelegance Creative Commons - Attribution 3.0 Unported - CC BY 3.0 creativecommons.... Music promoted by Audio Library • Unconditionally - Brok...


The best explanation of ImageJ in RUclips. Thanks a lot!
Thank you so much for this video.
when I press the "M" button, I don't see the yellow bars with the number on the selected point like in the videos (6:23) so I can't remember which one I chose. Tell me how to display it, please. Thank you
I am having same problem as well
could you explain Raman analysis of Nano particles
A.O.A Respected Admin.......It is very helpful for me....Thanks a lot...
You are welcome.
SOFTWARE Not downloading
If SEM image is in "um", we will set scale for micrometer or first have to convert it in "nm" and then set scale?
I have to calculate nanoparticles size and distribution but result images i got are in "1-um" size, i used your method and size i calculated is coming in 0.3-0.5
Did i attempt it correctly?????
It does not matter, if your scale is in either in um or in nanometer.
If you set the scale as 1 um and then calculated it and came up as 0.3 - 0.5 um size then its means your particles size is 300- 500 nm.
and if you set the scale 1 um = 1000 nm (i.e. put 1000 nm instead of 1 um) then you will directly get 300 - 500 nm size.
So, it does not matter.
@@nanoworld6122 thank you 🙂
Sir how to put micro symbol during seting of scale
@@noreenramzan6727 copy past from MS word.
@@nanoworld6122 thank U Sir
Hi Amjad, I reckon you can use an in-built function in the origin software if you want to show the gaussian distribution over a histogram. I just thought it was an unnecessarily long video.
Thanks for this vidio. Very very important for me. Um. Sorry. May I ask for a request? Would you make a tutorial about how to analyse FTIR diagrams? Thankyou. Good luck >_
Request noted.
Thank You
Sir will you help me for some image processing, related to trichome (hair like structure on leaf) counting ? I am trying but not getting proper results.
Why you've used bins in the end in origin graph ?
is it necessary for finding Nps Size ?
Please sir make a video on How to calculate PORE SIZE, PORE DIAMETER from SEM images using ImageJ software.. Please!
we are welcome it dear sir. thanks for
The straight-line keep disappears when I measure the new diameter. What should I do?
Go to Analyze > Set measurements > Mark option "Add Overlay"
ruclips.net/video/9NLo-LL4kko/видео.html
Hello! Can you explain how to find the maximum and minimum of inclusions and volumetric content of the particles using image j? thanks a lot .
Thank you 🌺🌺
You’re welcome 😊
Bro Thank you for this video. I am very glad that I have learned it. make other videos for us
sir please upload the video how to find band gap via reflectance data please guide about it.
I will be waiting with you
Who is there from IST ?? Pleasant, am also from IST Islamabad
Hello. Im student of fashion designer but it's not things that I want. I want to learn making intelligence fabric. Like nanofiber.
Can you please guide me how to enter this area and start watching the tutorial? What resources should I use?
Sorry, but can I use Image J software to calculate my research and publishcation it a normally way
it's fantastic, thanks a lot
Thank u very much
XC value is mean or what? Thanks a lot for this video
Your videos help us a lot.try to create more videos and share the knowledge
JazakAllah
I appreciate it!
i could find link for ImageJ software
sir please upload the correlation graph example.
This is the best explanation. It is use full for beginners
Awesome videos!!! wish it has audio with it!!! The word document has it perfect to follow the important steps!!!
Thank You
Sir, why did you change y axis to frequency?
very informative vedio.. thank you. similarly can we know the diameter and shape of nanoparticle
Yes we can
@@nanoworld6122 thank you. will you suggest me which software will helpful for the mentioned above
@@lakshmidurga2188 ImageJ
is it necessary to select width of nano wire . why not length .
It is because nanowires are 2D confined materials.
@@nanoworld6122 thank u Sir ...
Thank you so much. You saved my life haha
Thank you, so informative
thank u very much , god bless u
thanks, that was so usefull
How to measure the velocity of a rising bubble in any solution using Image J?
How to enter micrometer in unit window
Awesome!!!
HEY, YOUR IMAGEJ SOFTWARE DOWNLOAD LINK IS NOT WORKING....
CAN YOU PLEASE UPDATE..SO THAT I CAN DOWNLOAD
checked and found it working. For your convenience, I have attached the link here.
wsr.imagej.net/distros/win/ij153-win-java8.zip
@@nanoworld6122 HEY THANKS.. yeah found later myself that. :)
great helpful video
Thanks lot for sharing this.
thanks so much
Do you know how to measure the alignment of nanofibers with FFT in ImageJ?
you are helping new researchers a lot. Thank you.
Is there any automatic way to measure the diameters? (I know you'd say there is no such thing, but that's not acceptable).
I know an automation method for the estimation of particles size. However, I'm not aware of such method for the estimation of diameters.
@@nanoworld6122 I found that the opencv library in Python can do it. Thank you anyway.
Why my results in excel are not separated into columns? It's all in one column. Can you help me?
let me check it, email me your data.
when you save your data, dont save as cvs format. change with xls
You make mistake because you focus on width, how about length?
I don't think so,
Because, these are nano-wires and nano-wires are 1D material. For that reason, I'm calculating the diameter of the wires. Moreover, the estimation of length is not possible in my case. Because, you can measure something if the both end of the object is visible. In my case, I can not see the both end of the wires therefore I can not measure the length.
@@nanoworld6122 ok
Bro please tell me what is 'MIN' and 'MAX' with circle measurements of particls
Minimum and maximue value
You calculate diameter? what about particle size then? what about the length measurement instead of width/diameter?
Nanowires are 1D materials. Which means you have to calculate its diameter only. However, you can calculate the length and aspect ratio as well. Only if both end of the nanowire are visible in micrograph. In my case, the two end of wires were not visible in the image, that's why I only consider calculating the diameter.
@@nanoworld6122 Thank you. So, what will be particle size then? i mean if I have to write the nanowire/rod-shaped particles' particle size, then what should I write?
The size/dimension terminology is usually used for particles.
If your material has the rod/wires shaped, then wite the diameters.
@@nanoworld6122 Thanks a lot
Sir, zip file image didn't open
Unzip it before opening in ImageJ
Thanks so much am really blessed with this tuto. thanks again your a God blessing
You are very welcome
Superb video.👌👌
Thank you! Cheers!
can you help me how to instal image j software?
whats the problem?
❤