How To Perform Simple Linear Regression In Excel (HINDI)

HTML-код
- Опубликовано: 23 дек 2022
- #YOUCANLEARNECONOMICS
#ECONOMICS
I’m going to show you how you can perform a simple linear regression test by using Microsoft Excel.
After opening XLSTAT, select the XLSTAT / Modeling data / Regression command. Once you've clicked on the button, the Linear Regression dialogue box will appear.
Select the data on the Excel sheet the Dependent variable. The quantitative explanatory variable.
As the column header was selected for the variables, the Variable labels option needs to be activated.
The computations begin once you have clicked on OK.
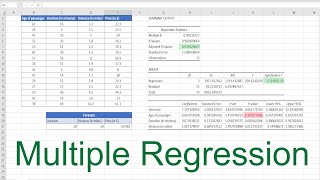
Interpreting the results of a simple linear regression
The results will then be displayed. The first table displays the goodness of fit coefficients of the model. The R² (coefficient of determination) indicates the % of the variability of the dependent variable which is explained by the explanatory variables. The closer to 1 the R² is, the better the fit.
It is important to examine the results of the analysis of variance. The results enable us to determine whether or not the explanatory variables bring significant information (null hypothesis H0) to the model.
Subscribe me @ / ezclassesfaghsa
Like me on Facebook @ / faghsa
Follow me on Twitter @ ?lang=en
Mail ID: faghsa1760@gmail.com


Shandar topic, liked before watching
Thanks for liking
Very good approach, Ma'am plz keep coming up with such videos analysing data with excel. Thnk for this video
I will try my best
Great video, please keep coming up with such videos. Thank you, appreciate the effort.
More to come!