Predicting Stock Price movement statistically

HTML-код
- Опубликовано: 21 авг 2024
- Please support us at:
/ garguniversity Predicting Stock Price movement statistically. Here we use historical data to predict the movement of stock price for next day. It is completely mathematically valid.
The mathematical model of Brownian motion has several real-world applications. Stock market fluctuations are often cited, although Benoit Mandelbrot rejected its applicability to stock price movements in part because these are discontinuous.
This is a momentum indicator used in technical analysis, which compares the stock's closing price to its price over the course of a particular time frame. During an upward trend in the market, a stock's share price will close near its high (highest price traded), and when in a downward-trending market, the security's price will close near the low (lowest price traded). This may determine whether a stock is overbought or oversold, thus predicting a possible momentum change. www.gargunivers... Check out Ebook "Mind Math" from Dr. Garg
www.amazon.com...
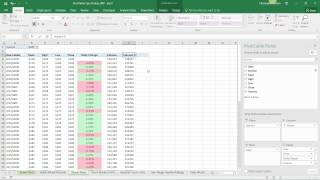


Yes, I am just calculating the % daily price change and then sorting these price changes to plot distribution function.
As you can see the daily probabilities are very symmetrically distributed. Mode is at 0% return. Low gain or loss is more likely then high gain or loss.
wadafaq did you record this video with? A potato?
Nice Video clip! Forgive me for chiming in, I would love your thoughts. Have you researched - Sanames Stockify Scripophily (Have a quick look on google cant remember the place now)? It is an awesome one of a kind product for discovering the best options trading technique without the hard work. Ive heard some great things about it and my close friend Aubrey got cool results with it.
From your sample data, can you explain what will be the answer for the stock at 90% probability level? Will it always be negative? What should be the ideal probability level one has to set?
1 year ago when I watched this video, I feel useless ; today, I watched this video, I feel precious. Probability is one of the ways to win in stock option market.
It's very hard to actually see what you're doing, I've gotten to the lookup part and unfortunately can't follow from there, do you have a pdf version of these instructions or a better quality video at all? Very helpful info
Can someone explain why he subtracted 1 from the 0.7 to get a 30% change of the stock returning that amount? Didn’t think you had to do that
if sticking to analyze a current trend (not if it will continue) then perhaps a regression line is better (pay attention to the correlation coefficient). note that it will not predict when the trend ends, just its possible behaviour
Last part of calculation is not even clear to see or understand. Please explain or write the formula in comment section.
Garg U, thank you. Traders need more science like this.
Not sure how you are calculating that cumulative distribution function. Hard to see the numbers on your spreadsheet. Don't you need to find out how frequently the price of the stock changes by a certain amount to determine the distribution function?
Can you upload the same video by using any other stock as example with more clarity so that everyone can understand. Thanks in advance.
I see your percent change, may i suggest using P1/P2-1 more efficent, one less step.
Good video.
That's a simple brilliant tool for understanding volatility in stock prices.
Hi, thanks you for your video but could you please reupload it again with more quality?.. Thanks in advance.
Gaining in this example. But, loosing would be same too as distribution is very symmetrical.
So, could you explain a little bit more to why you chose the commutative distribution , also why did you have to order the %change.
Why did you choose 0.7? How did you choose this?
Appreciate the work , but the quality of this video makes it difficult to follow.
Hello enjoy your video very much and found it informational in a all ways. have some questions if you can share them will appreciated. First do you have some more videos in finance math in pricing shares of stock or option etc. Second is it possible to go deeper on the subject for calculating the price of the stock for a long term investment and calculating the expected return in time from the past history. and finally how did you do the fast filling of the excel column with out going out to infinity when you paste the formula or the number sequencing from 1 to 1000.
thank for the video and sharing this knowledge.
many blessings.
dont be angry you cant make money in the market. it isnt for everyone. Great video
very informative stuff. i will practice this. I also like how you explain things. Thank you.
quality is poor nothing on screen...re-upload it.
VIDEO QUALITY IS VERY LOW
Don't you mean 20% chance of the stock gaining or losing ?
cannot even see the video clearly
sorry but what exactly is he typing when he subtracts 1 and multiplies 100
Resolution is bad on this video. Please check this video for better resolution.
Mathematical prediction for stock movement
I am typing (F2-1)*100
are there platforms that offer copy buffet that is not glennridge capital...i have sent in my documents 14 times and a mouth later i still have a dead account with founds i cant touch
Thanks! Have a super sparkly day! :)
Thank you for this video, had stats but never liked it. Whether there is any merit to this or not, it does seem interesting. I will try to replicate to understand what you did, I suspect that this is just expecting the probability distribution to come to be the same distribution as in the past (if so then this might work in very cyclical stocks only). your contribution is appreciated.
replicated what you did.
Math and wording seem sound.
But I do question the usefulness of this (Unless you are sticking to the time frame of a current trend). the math itself will not help you in your prediction of if the trend will continue, it will just tell you if it does continue the probability of getting a particular % or higher.
Do we need 1,000 cells of data? Can we just use prices from the past 5 days?
No. Large amount of data is required for accuracy. You can use past 5 days but error bars will be huge.
Option Trader Thank you, and do you know why at 2:49 he says a 3.3% decrease in price? I don’t see a negative next to that number
cheers! nice video. just reupload please because the quality isnt very good
cant understand anythng ....pls explain logically and easily
Do you have a base research paper for this method of analysis? If you have, can you please provide the link for it?
This is a basic concept of Cumulative distribution. There is no paper. I just thought of it.
Can you explain more of your thought process behind this video? I am currently researching on stock market analysis and if you do explain more, it would be quite helpful. Thanks in advance! :)
Give me a call 0013129276784
Good morning everybody. The TokenGo platform enables each of us to create our own business. Entrepreneurs, the authors of startups, projects explicitly need simple to understand and launch sites for the ICO procedure, allowing easy integration with the crowd-hosting block-platform. TokenGo's ICO Landing page constructor solves this problem to the fullest. ICO authors have the flexibility to customize their site for ICO and quickly, in a few clicks, integrate it into the TokenGo web platform.
are you rich right now? just want to know. cheers
Instead of calculating a probability of a % return, is there a way to find the % return with the greatest probability? like using the spreadsheet, and the data gives you, by 60%, the %change will be -8% .... something like that?
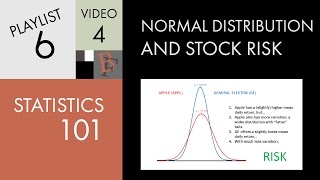
What if u use a normal distribution plot?
Things2doBeforeIdie you would first need to calculate the probability of a % return and then use that chart to count/determine which %return has the highest frequency, right?
I think this would be more accurate for volatile shares
This method can't work at all. I experimented the calculation to stock price that had increased on the next day. With all the data on the day before the stock price increase, the result showed the price will drop. But the reality is the stock price increased. Totally useless method
This is terrible visually.Did you watch back this video after recording?. so bad for the eyes
thanks
statistically... 360 resolution video sucks!
where can i download this sheet?
I use MarketXLS. It works great for me.
Where can we get this...
I think you come from 1321 years
Theeese numbers, for god's sake. NOT (this) numbers!
This was great, I been tryin to find out about "previous stock market prices" for a while now, and I think this has helped. You ever tried - Fenason Zeyames Idea - (do a google search ) ? Ive heard some amazing things about it and my work buddy got amazing success with it.
You can predict the price but your broke still, huh?
+OmAr LiVeS I am not broke. Also, This is the methods that is used to price options and used by banks to place bets. I tried to simplify for you.
You can comment on RUclips vides, but you still can't spell "you're", huh?
you are so rude
You probably needed help and you should be thankful for that.🤷🏾♂️