Ruth, there are a lot of great tips here but one of the simplest is also a real time-saver: searching for all text and alignment fields at once. Many thanks for sharing your advice across so many excellent videos.
Hi Ruth, Thank you so much for your video. I have been looking for the function of showing values as rows for several days. Your video saved me a lot of time!!!
I have referenced this SO MANY times - a lot of it for the same thing over & over because for some reason I just cannot remember how to do the "step out"! Thanks so much :)
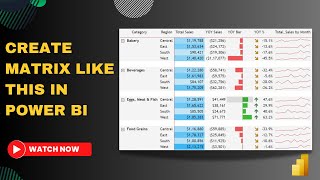
6:51 Show in columns has been save my life several times. On my experience, Excel Finance user and some Sales People love to have table in that way. It works / looks fine if you have few categories-few rows, so if give you a quick overview about how the month is going on and adding a KPI/conditional formatting provides a quick look of it's red or green. It is more like a manual table created on a spreadsheet where each value is in cell (C2) and below the other one (C3) and so on. Sometimes I used to save space on the canvas. Having columns "unpivoted" give more space to the right save of the visualization
I had the same experience working for a customer. Measures on rows, and actual, goal, prior year, changes,... values on columns. To finally have like a KPI matrix and being able to have an overview.
Really wanted to say that your videos are really entertaining while also being informative. I come home from work working with Power BI all day (I am blessed, this is almost a hobby) and to relax I put on some of your videos :) definitely makes it easier to learn - and everything is told in plain English that is easily understandable. In return I try to support with a comment and a like wherever I can! :)
Hey Ruth , love this. Just this week I developed a report using a Matrix and some clever tooltips to display covid patients /wards they are on and then on tooltip display all patients who shared a space with them on each date as they go from positive/negative etc. It looks amazing and really shocked me how much you can squeeze out of BI and matrixs in particular.
Big Thank You Ruth :) you have cleared all my confusion related to Matrix Visual specially +/- & Step Layout. I have one question on matrix ,can we achieve slicer to highlight values instead of filter in matrix.
Dear Ruth, there are two things that are still bothering me in a matrix, maybe you have a solution for it as well: 1. is there a way to sort the columns headers (e.g. from left to right) based on the column totals (not column names)? 2. if in a martix in the column area you have e.g. years (2017, 2018, 2019) and value sales and unit sales, the first layer of the column headers is a year and then all values below. Is it possible to reverse it (like in pivot tables in Excel) that first you have e.g. value sales (and years below) and unit sales (and years below)? I can't seem to find that option. I would really appreciate some tips on it. Many thanks in advance! :-)
Is there a way to torn off the sorting option on the column? i have tried this but it just wont go away. i need to load my row values in a certain order but it keeps sorting it. is there any way around this? i m missing ssrs so much after this problem. 😊
OMG!!! You saved me a lot of time. Just one more question - If in the matrix, i want to show the average ( in place of Grand Total)- Is there a way to do it?
Thanks for your video. Is there any way to show group headers, then a specific measure for those groups and add then a further group and measures? I can do this in reporting services, but I am not able to find a way in Power BI.
Loved the tips thank you Ruth. I notice that the YOY 178% never was centered. I am having problems finding out how to center my Totals on the row and column
Thanks Ruth, very useful for me . I have a question... In a matrix, there are 5 rows like sales, sales visit, sales prospect, sales order... i want to collapse these 4 sales into 1sales row (only sales)? Plz help....
Hi Ruth, I need your suggestion for how to approach to create this report Scenario: I want to build something like a quick YOY comparison to identify the Sales gap of a client (Slicer) between last year vs Current year by Month by product Example: Last yr a Client bought 10 products Worth $1,20,000 in July Current situation is CY($70,000) - LY($1,20,000) = $-50,000 (which is easy to calculate) Now I want to build a dashboard which can dig deeper and can identify the reasons of the GAP. There can be 5 reasons for GAP 1) Few products didn't get sold this year (Cancel) 2) Few products got sold before July (Early Renewal) 3) Few products got Postponed (Late Renewal) 4) Products booked with less value (Discount) 5) New product Sold this year (New) I have been doing this evaluation manually But is there a way if I can click a client of a slicer, it can show me the above 5 reasons...
Thanks for the video. Is it possible to change the subtotal labels as dynamic. Currently there is no option to change subtotal labels to dynamic based on the values?
Thanks for the video, I have a question, what if I want to visualize all the columns always regardless of the filters or content... i.e. Sales for all months including when there were 0 on months.
Hi Ruth, Thanks for the video! I have a question in matrix visual which I am still trying to solve. I want to display zeros in blank cells on a matrix but I can't find way to do that
Hi there!! I figure you guys will know this one for sure!! I have a matrix visual and want to add a series of true/false data columns to it. Unfortunately, data with a data type of "True/False" displays as an INT and is giving me a "Count of {fieldname}" in the data options rather than a "not summarized" option for the True or False column when used in a Matrix visual. All I get is a value of "1" for every true/false column in the matrix. I know you guys will know a workaround!!! I am using the April 20224 version of PowerBI. Thanks!
I just created calculated columns and set them to either "true" or "false" based on whatever the original column value was and then used those calculated columns in the matrix instead. Works fine but maybe there is a better way to do this so that no additional columns need to be created....
Thanks for sharing this information. it was helpful. I have a question related to sorting Columns. "Suppose we have 4 columns (A, B, C, D) then they are sorted by default alphabetically. What if I want Column C to always displayed 1st, then A, B and D in any order?" please let me know about it. Thanks.
Thanks Ruth. I am putting a date hierarchy in the columns and it returns 0 in unselected dates. The column header still appears for the dates u selected in the filter but with no values. How can I hide those date columns ?
Hi Ruth, is this possible? In power bi, i created a matrix visual with rows division, group, category, class, subclass and brand, now I have a supplier slicer, now I want that once I filter a certain supplier, I want the division, group, category, class, subclass to be filtered only for those that has that supplier but I want to show all the brands from the filtered division, group, categories, class and subclass whether those brand is from the supplier or not. The name of the table is 'item Details'. The matrix visual to be used is only 1.
Great video! However I'm still figuring out how to create a profit and loss statement with a matrix visual. Especially how to enforce a fixed layout and custom subtotals are tricky. Anone some good suggestions how to start?
Unfortunatelly Power BI does not offer adeqate solution (Huge disadvantage!!!). You can try for example to prepare separate measure for each line of P&L and then use "Values show on rows" option in matrix. Check also: ruclips.net/video/lzYaveNRcQU/видео.html
Hi it's really amazing video, that helps to save some time..I have one query on Matrix table hoping you will answer that..let us suppose in Matrix table I have 5 columns..and I want to make font type is bold for only one column how will I do that.
Hello Ruth, As always very informative video. Thanks a lot. Is it possible to have row subtotal as average and column subtotal still be a total or sum?


"Show columns on rows" was a big time life saviour for me! Thanks a ton Ruth! 🔥
Yey!!
/Ruth
@@CurbalEN Really Ruth... It was a big time life saviour..thanks for these wonderful videos 😃😃
Yey!! 🥳🥳
Yes true... Thanks a ton.
Ruth, there are a lot of great tips here but one of the simplest is also a real time-saver: searching for all text and alignment fields at once. Many thanks for sharing your advice across so many excellent videos.
And thanks for your feedback !
Hi Ruth, Thank you so much for your video. I have been looking for the function of showing values as rows for several days. Your video saved me a lot of time!!!
Music to my ears!!
Great summary. I didn't you could enter text and find all the options containing that text. A big time saver! Thanks toda muchas gracias, tack!
Yes, and you can do that with any visual property!!
I have referenced this SO MANY times - a lot of it for the same thing over & over because for some reason I just cannot remember how to do the "step out"!
Thanks so much :)
I do the same 😂
6:51 Show in columns has been save my life several times.
On my experience, Excel Finance user and some Sales People love to have table in that way. It works / looks fine if you have few categories-few rows, so if give you a quick overview about how the month is going on and adding a KPI/conditional formatting provides a quick look of it's red or green. It is more like a manual table created on a spreadsheet where each value is in cell (C2) and below the other one (C3) and so on. Sometimes I used to save space on the canvas. Having columns "unpivoted" give more space to the right save of the visualization
Thanks for sharing !!
I had the same experience working for a customer. Measures on rows, and actual, goal, prior year, changes,... values on columns. To finally have like a KPI matrix and being able to have an overview.
Thank you so much! Keep sharing making segments and spreading the love
Will do!!
Is the first time that I watch one of your videos, thank you for all the passion that you transmit while you're explaining.
Greetings from Ecuador!
And thanks to you for the feedback!
Really wanted to say that your videos are really entertaining while also being informative. I come home from work working with Power BI all day (I am blessed, this is almost a hobby) and to relax I put on some of your videos :) definitely makes it easier to learn - and everything is told in plain English that is easily understandable. In return I try to support with a comment and a like wherever I can! :)
An honor to be your wing (wo)man ;)
And thanks for the support, it does make a difference!
100 % agree with your words..Million Thanks Curbal
Thank you Thank you Thank you!! I cannot tell you how many questions this solved for me!!
I always appreciate your helpful tips, Ruth! You are legendary 😊
😊😊
I love your changing text size trick!! Thank you for the awesome tutorial =)
Hey Ruth , love this.
Just this week I developed a report using a Matrix and some clever tooltips to display covid patients /wards they are on and then on tooltip display all patients who shared a space with them on each date as they go from positive/negative etc.
It looks amazing and really shocked me how much you can squeeze out of BI and matrixs in particular.
Sounds really cool, well done!! 👏👏
Brilliant summary and a great go-to resource....thanks very much Ruth. Keep well.
You too Dave and thanks :)
/Ruth
This one video is probably the most useful thing i've seen in powerbi
Wonderful to hear!
Gracias "Curbal" eres una tigresa en el los tips de Power BI....Good luck and happy day!!!
Excellent tutorial Curbal. Super explanation!!!
Yey 🥳🥳
It's really really helpful, thank you so much 😊
The show only grand total trick is awesome too!
That "show on rows" piece just saved me a whole lot of work! Thank you!
Thanks so much for sharing these! :)
Applied some of these tips in my matrix report. Thanks Ruth
Some great content here Ruth! Thank you!
Thanks Ruth, This escaping me from messing up with the matrix.
Thanks for the video. Very helpful indeed
Thanks for sharing the knowledge... Really gud one 😊
The matrix has like 1M settings so I hope this takes us one step forward!
/Ruth
Thank you! Great Video!
Thank you very much. Very useful.
Thank you very much!!! This video helped me a lot.
Your genius...Million million thanks..
Big Thank You Ruth :)
you have cleared all my confusion related to Matrix Visual specially +/- & Step Layout.
I have one question on matrix ,can we achieve slicer to highlight values instead of filter in matrix.
After searching for a property, you can also reset the Format settings by clearing the Search box or clicking on Fields tab and back on Format tab.
Great tips! Helps save a lot of time. Thanks!
My pleasure!!
/Ruth
Dear Ruth, Thanks a million for your brilliant tutorials!!! Number 8 (show column as row) was new for me👌
🥳🥳🥳
@@CurbalEN I can't find the show on rows option in the value pane, it seems that is no longer available anymore, am I correct?
the best i was looking like anything
best in the business thanks
Many thanks for the tip 7 and 8 and great content.
Fab!!
Thanks to share such tips. Nice options. Really good video.
Thanks!!
Thank you so much very informative
I just had to sign into my RUclips account and like this video because this video has really helped me out!
Thanks for the feedback :)
Thanks so much I didn't know about the show rows as columns options shaved 2 to 3 seconds in load time because of combining vizs
Priceless!
thanks very much Ruth, you are my inspiration
Thanks!
Very nice and veeeeery useful tips…. Thanks for sharing this video
Thank you for watching!!
Gcs Ruth, Show columns on Row, lo había usado y no me acordaba donde estaba, te ganaste un like.
Y tu también ;)
Great tips, most I will be using. Thanks
Yey!! 😊😊
All very interesting! Thanks for sharing! 👏👏👏
Yey!! 🥳🥳
Gracias Ruth excelentes tips para formatear matrices. Buen fin de semana.
Igualmente :)
Thanks so much. Very useful. Much appreciated
My pleasure!!
Gracias Ruth , muy productivo como siempre .
Perfecto! :)
You are so super funny while explaining stuff. Awesome
You saved my day! ... Again :-)
Dear Ruth, there are two things that are still bothering me in a matrix, maybe you have a solution for it as well:
1. is there a way to sort the columns headers (e.g. from left to right) based on the column totals (not column names)?
2. if in a martix in the column area you have e.g. years (2017, 2018, 2019) and value sales and unit sales, the first layer of the column headers is a year and then all values below. Is it possible to reverse it (like in pivot tables in Excel) that first you have e.g. value sales (and years below) and unit sales (and years below)? I can't seem to find that option.
I would really appreciate some tips on it. Many thanks in advance! :-)
Great video.. Thanks for sharing nice video
I got solution with help of this video, thanks lots
wonderful ......thanks a lot
ur great
Thank you so much!!
You saved my life ( once again)!
At your service !!
Totals and SubTotals... jajaja. Great trick in order to hide the subtotals only in rows!! 👌 Thanks a lot!!
You welcome!
Nr 8 was new for me. Keep up these good vids, you have a great way of communicating this stuff :-).
Thanks!
/Ruth
Thank you for tips, Is there anyway I can show the Matrices without scroll bar, just break the table and show side by side?
Great video! really useful!
Fab!
Thanks so much. Very helpful...
Yey!! 🥳🥳
Thank you😊
Is there a way to torn off the sorting option on the column? i have tried this but it just wont go away. i need to load my row values in a certain order but it keeps sorting it. is there any way around this? i m missing ssrs so much after this problem. 😊
Thank you. i enjoyed the video. You explain everything so well. :)
Thanks Nel!
Thanks a lot for sharing, Great video.
Thanks 😊
Excellent video and explanations.
What I would like to know is how to show the subtotals and not display the grand total.
OMG!!! You saved me a lot of time. Just one more question - If in the matrix, i want to show the average ( in place of Grand Total)- Is there a way to do it?
2.20 Search "text" and update size is a life saver :)
It definitely is :))
Appreciate your tutorials. Keep up the good work!
Will do! :)
/Ruth
Muchísimas gracias, no tienes idea de cómo me has ayudado a entender ésto
Million thanks
Many Thanks , I like your video so much.
Thanks!
Another perfect video .. Thanks!
Yey!! 🥳🥳
Great video!!!
Thanks for your video. Is there any way to show group headers, then a specific measure for those groups and add then a further group and measures? I can do this in reporting services, but I am not able to find a way in Power BI.
Loved the tips thank you Ruth. I notice that the YOY 178% never was centered. I am having problems finding out how to center my Totals on the row and column
Thanks Ruth, very useful for me . I have a question... In a matrix, there are 5 rows like sales, sales visit, sales prospect, sales order... i want to collapse these 4 sales into 1sales row (only sales)? Plz help....
Hi Ruth,
I need your suggestion for how to approach to create this report
Scenario: I want to build something like a quick YOY comparison to identify the Sales gap of a client (Slicer) between last year vs Current year by Month by product
Example: Last yr a Client bought 10 products Worth $1,20,000 in July
Current situation is CY($70,000) - LY($1,20,000) = $-50,000 (which is easy to calculate)
Now I want to build a dashboard which can dig deeper and can identify the reasons of the GAP. There can be 5 reasons for GAP
1) Few products didn't get sold this year (Cancel)
2) Few products got sold before July (Early Renewal)
3) Few products got Postponed (Late Renewal)
4) Products booked with less value (Discount)
5) New product Sold this year (New)
I have been doing this evaluation manually But is there a way if I can click a client of a slicer, it can show me the above 5 reasons...
Thank You Ruth for the very usefull content ,my question is can we move quick measure column from values to the rows in matrix
You should, but I have never tried
Hi Ruth, Is there any way we could change Column order? Thanks for your tips.
Thanks for the video. Is it possible to change the subtotal labels as dynamic. Currently there is no option to change subtotal labels to dynamic based on the values?
Thank you, these tips are very useful. Is there any way to add a custom row into the matrix?
Pls honey am in love with all the tutorials. More GRACE.
Thanks for the video, I have a question, what if I want to visualize all the columns always regardless of the filters or content... i.e. Sales for all months including when there were 0 on months.
awesome thanks
Thank u so much...
Show on rows will move all columns to rows but is it possible to move specific colmun to row?
Is there any way to drill down for rows as well as columns together
Hi Ruth,
Thanks for the video!
I have a question in matrix visual which I am still trying to solve.
I want to display zeros in blank cells on a matrix but I can't find way to do that
Hi there!! I figure you guys will know this one for sure!! I have a matrix visual and want to add a series of true/false data columns to it. Unfortunately, data with a data type of "True/False" displays as an INT and is giving me a "Count of {fieldname}" in the data options rather than a "not summarized" option for the True or False column when used in a Matrix visual. All I get is a value of "1" for every true/false column in the matrix. I know you guys will know a workaround!!! I am using the April 20224 version of PowerBI. Thanks!
I just created calculated columns and set them to either "true" or "false" based on whatever the original column value was and then used those calculated columns in the matrix instead. Works fine but maybe there is a better way to do this so that no additional columns need to be created....
Thank you so much, I use this visual a lot, my only challenge is where do I set up the column width???
You cant , the only way is to do it manually 😱
@@CurbalEN Pls check this video, I tried to follow it, but I still don't understand ruclips.net/video/gh0gc_6wtL0/видео.html
Thanks Ruth! I really like it! Gracias campeona mundial!
Yey!!
Hi Ruth (and everyone) great video, learned a ton!
My 'show on rows' is nowhere to be found, does anyone have any idea why and how I can fix it?
Should be there, search for it instead
Thanks for sharing this information. it was helpful.
I have a question related to sorting Columns.
"Suppose we have 4 columns (A, B, C, D) then they are sorted by default alphabetically.
What if I want Column C to always displayed 1st, then A, B and D in any order?"
please let me know about it.
Thanks.
Thanks Ruth. I am putting a date hierarchy in the columns and it returns 0 in unselected dates. The column header still appears for the dates u selected in the filter but with no values. How can I hide those date columns ?
Hi Ruth, is this possible? In power bi, i created a matrix visual with rows division, group, category, class, subclass and brand, now I have a supplier slicer, now I want that once I filter a certain supplier, I want the division, group, category, class, subclass to be filtered only for those that has that supplier but I want to show all the brands from the filtered division, group, categories, class and subclass whether those brand is from the supplier or not. The name of the table is 'item Details'. The matrix visual to be used is only 1.
Great video! However I'm still figuring out how to create a profit and loss statement with a matrix visual. Especially how to enforce a fixed layout and custom subtotals are tricky. Anone some good suggestions how to start?
It is in my list to crate a P&L, I just need time!
Unfortunatelly Power BI does not offer adeqate solution (Huge disadvantage!!!). You can try for example to prepare separate measure for each line of P&L and then use "Values show on rows" option in matrix. Check also: ruclips.net/video/lzYaveNRcQU/видео.html
Thanks!!!
Yey!!
Hi it's really amazing video, that helps to save some time..I have one query on Matrix table hoping you will answer that..let us suppose in Matrix table I have 5 columns..and I want to make font type is bold for only one column how will I do that.
Hello Ruth,
As always very informative video. Thanks a lot. Is it possible to have row subtotal as average and column subtotal still be a total or sum?
I know this is a old video and I was going through it again to see whether it covers what I am looking for.