Paired T-Test Example Problem

HTML-код
- Опубликовано: 22 авг 2024
- In this statistics video, I go over a paired t-test example problem. I walkthrough the steps of the t test to the conclusion. Paired t test is the same as a one sample t test, the difference is one has one input per person while the other has two.
Statistics Study Guide:
amzn.to/3xKBvwd
Prime Student 6 Month Trial:
amzn.to/3DdsHjE
Related Videos:
Unpaired T-Test: • Unpaired T Test Exampl...
Hypothesis Testing; • Hypothesis Testing - O...
P-Value and Statistical Significance; • What is a P Value? P-V...
#PairedTTest #Statistics #TTest
Email questions to learntostats@gmail.com


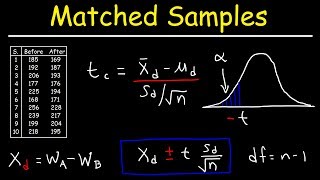


In this example I used Group 2- Group 1 for calculating the difference. The proper equation is Group 1 - Group 2.
This was a two-sided test so that did not matter given the difference would be significant either side it showed up on.
For hypotheses that looked at greater than or less than, make sure to use Group 1 - Group 2.
what an absolute legend. Saved my assignment
Thank you sir for obiliging my request snd posting this vedeo. You have explained in a lucid way. This is helpful to me. Thank you sir.
You're welcome, I am glad I could help.
Hi! What statistical tool should I use if there are two groups (control and treatment) and both will undergo pre-test and post-test to know the baseline of their score. Thanks!
Great question!
I would use an ANOVA with a post-hoc test like Tukey or Bonferroni.
This will reduce your Type 1 error compared to using a bunch of Two-Sample T-Tests.
Here is an article that goes over an example like yours:
statisticsbyjim.com/anova/post-hoc-tests-anova/
@@Learn2Stats Thank you! Appreciate it!
Sir
Is this example for..
paired T test for difference of mean ??
Yes
Is the "standard error of difference" is the same as the "Standard error of mean difference"?
In most cases, yes. If there is any confusion, just ask for clarification.
Great explanation (Learn2Stat)
but I have I question if you don't mind
the difference colum you made made up of ( Test 2 - Test 1 = Diff ) What about if you do ( Test 1-Test 2= Diff ) would that be good or Not good to find out whether there is an improve in student's performance.
thank you
If your hypotheses is equal and not equal, it will be the same.
It changes when your hypotheses is greater vs less and vice versa. The important thing is to be consistent.
@@Learn2Stats Thank you Sir/Madam now I!m fully understand your video.
How to we know that its two tailed test ???
The hypothesis will be:
Ho equal and Ha not equal.
If there is a greater than or less than in there it is one tailed.
@@Learn2Stats my t stat for 1 question was 1.69 ....mam took the df through two tailed. ..idk why it was taken two tailed? Y not one tailed 😂I'm sooooo confused
Thank u
Let me know if there are any other statistical topics you would like explained. I enjoy specific requests.
@@Learn2Stats I definitely will
Sir I have a question regarding this topic for my research. Hoping for a fast response...
No oroblem. You can continue here or email learntostats@gmail.com.
@@Learn2Stats I already sent it via email, sir.
My research objective is to determine the effectiveness of QR code-based contact tracing in mitigating COVID 19 cases in our municipality. My first thought was to use the no. of COVID-19 cases before and after the intervention/implementation of QR code-based contact tracing because according to what I have read on Google that Paired t-test would help you determine if an intervention is effective or not if the result of Paired t-test significant or 0. So if my given values are only from the COVID-19 cases before and after the intervention then I would only have two "numbers" (pardon, I'm not sure if it's the right term) which will be the cases before the intervention let's say 55 covid cases and then the cases after the intervention 99 cases. I followed the procedure of a paired t-test from a website on Google, where it says I must solve first for the sample mean, which would be "(55+99)/2 = 154/2 = 77", then for the sample standard deviation
"(55 - 77)² = (-22)² = 484
(99 - 77)² = (22)² = 484
(484 + 484) / 1 = 968 / 1 = 968
√968 = 31.11
31.11 = sample standard deviation"
I divided the sum of the squares with 1 'cause the source says that if you're solving for a sample standard deviation then n-1 which is 2-1.
And I'm not sure what to do next, my sources say that I must solve next for the test statistic and then calculate the probability by observing the test, but I don't have this table for t-distribution...
Are my given values enough for me to use the paired t-test? Am I on the right track? Or am I using the wrong method?
I'm really sorry for the disturbance, I just don't know how I will measure/solve for this...
I understand. Paired T-Test would not be appropriate because in order for you to do it the samples before and after need to have the same subject (person). It would be better to use a Two-Sample unpaired T-Test that I show here: ruclips.net/video/2oomtM5L2mY/видео.html.
The reason for this is because the paired t-test relies on the calculated difference of the subject mean before and after. For example if you have 3 subjects and they have a value of 1,1,2 respectively and then after the intervention those same subjects have 3,3, and 4 for their values, you would then calculate the difference (3-1),(3-1), and (4-2) and then proceed to run what amounts to a simple T-Test on the difference values, not the actual values given.
The reason the unpaired T-Test would be better is because it treats the samples as independent as there is no carry over from before the intervention and after. I say this because you should not start with a sample of 55 before and then 99 after. Paired T requires equal sample for both as they are the same subjects ( individual people) and not different subjects. Treating the before and after as different populations is justified based on independence and you will still be able to see if the intervention was successful.
If there is any carry over from before and after for subjects, you can run a paired T-Test on that part of the sample and run an unpaired T-Test on the rest.
Let me know if this helps or have more questions.
@@Learn2Stats Thank you very much, this was a great help in deciding the statistical treatment of my research